
Bitcoin’s latest rebound to $74,050 on Thursday is running into immediate selling pressure as short-term holders move coins to exchanges in large volumes, suggesting the market’s most reactive cohort remains unconvinced by the recovery. On-chain data shared by CryptoQuant contributors indicates that traders who bought Bitcoin only weeks ago are now locking in gains rather than holding through the bounce, creating a fresh pocket of supply just as the market attempts to stabilize. Bitcoin Short-Term Holders Cash In According to CryptoQuant contributor Darkfost, more than 27,000 BTC in profits were sent to exchanges by short-term holders (STHs) over the past 24 hours, one of the largest spikes recorded in recent months. The metric tracks coins moved to exchanges by investors who are currently in profit, often interpreted as a precursor to potential selling pressure. Related Reading: Bitcoin Price Suppressed By Shadow Banking Rehypothecation, Saylor Says “Despite the slight recovery of Bitcoin, STHs (Short Term Holders) do not seem convinced and prefer to take profits quickly,” Darkfost wrote. “Over the past 24 hours, STHs have sent more than 27,000 BTC in profit to exchanges, which ranks among the highest levels observed in recent months.” The dynamic appears concentrated among the most recent buyers. According to the analysis, the only cohort currently able to realize meaningful gains consists of investors who accumulated Bitcoin between one week and one month ago, with a realized price near $68,000. That positioning places them directly in the money after Bitcoin’s latest bounce toward the low-$70,000 range, creating a natural incentive to exit positions quickly. “STH are known for being reactive and emotionally driven, especially the youngest cohorts,” Darkfost noted. “Current news flow and macroeconomic projections remain rather negative in the short term, which makes this behavior relatively understandable and, in this case, fairly rational.” Related Reading: Bitcoin To $11 Million By 2036? This AI-Deflation Thesis Is Turning Heads For now, that behavior translates into near-term supply. “This represents selling pressure to monitor, as STH do not yet appear willing to hold their positions for longer,” he added. Repeated Pattern Around Range Highs Separate market structure analysis points to another pattern that may be reinforcing the selling. CryptoQuant contributor Maartunn highlighted a recurring technical setup that has played out multiple times in recent months: brief breakouts above key resistance levels followed by swift reversals. “Deviations above the Range High keep getting sold,” Maartunn wrote. “Over the last few months, BTC has shown the same pattern three times: break above the range high, short-lived deviation, sharp move lower.” The most recent instance occurred as Bitcoin briefly pushed above a range ceiling near $71,000 before stalling. “The latest deviation just occurred around $71K,” he noted. “If history repeats, this level may again act as a trap for late longs.” The pattern was visible in early-October 2025 and mid-January 2026. Breakouts above local range highs were followed by rapid pullbacks, reinforcing the idea that liquidity above resistance levels has been used primarily as an exit point for sellers. At press time, Bitcoin traded at $70,127. Featured image created with DALL.E, chart from TradingView.com

Five major mining companies sold more than 15,000 BTC in five months. February saw record sales as Bitcoin’s price dropped to $70,000. Continue Reading: Bitcoin Mining Giants Ramp Up Sales as Prices Drop Sharply The post Bitcoin Mining Giants Ramp Up Sales as Prices Drop Sharply appeared first on COINTURK NEWS .

Bitcoin is testing the $70,000 level after briefly surging toward $74,000, as the market attempts to stabilize following a volatile period marked by geopolitical uncertainty and rapid price swings. While the recent rally helped restore short-term momentum, analysts are closely monitoring on-chain data to determine whether the move reflects a broader shift in market structure or simply a temporary recovery within an ongoing consolidation phase. Related Reading: The $73,000 Test: Crowded Shorts And Negative Funding Fueled Bitcoin’s 15% Recovery According to top analyst Axel Adler, recent exchange flow data reveals a notable development that could signal underlying accumulation. An unusually large Bitcoin outflow was recorded this week, with approximately 31,900 BTC leaving exchanges in a single day. Historically, events of this magnitude have often been associated with large-scale transfers into cold storage, suggesting that some market participants may be moving coins off trading platforms for longer-term holding. Over the past seven days, Bitcoin netflows from exchanges have remained consistently negative. Daily outflows included roughly 2,867 BTC on February 27, 1,205 BTC on February 28, 251 BTC on March 1, 6,129 BTC on March 2, 1,819 BTC on March 3, a sharp 31,900 BTC on March 4, and 3,478 BTC on March 5. In total, approximately 47,700 BTC exited exchanges during the week, one of the largest weekly outflow figures observed over the past year. Stablecoin Flows Reveal Liquidity Deployment Into Bitcoin The report also examines stablecoin activity across exchanges, highlighting an important shift in liquidity dynamics during early March. Data from the All Stablecoins (ERC20) Exchange Netflow metric tracks the daily net movement of stablecoins across trading platforms and provides insight into how capital flows into and out of the crypto market. For most of 2025, stablecoin netflows displayed a largely neutral pattern, characterized by alternating inflows and outflows without a sustained directional trend. Several notable spikes occurred during the year, including inflows of roughly $2.7 billion in July and approximately $2.4 billion in September. However, a more significant regime shift emerged in early March 2026. Related Reading: The $1.35 Floor: How Extreme Negative Funding Is Priming XRP For A High-Velocity Trend Reversal At that time, the chart recorded a large stablecoin inflow of about $1.1 billion entering exchanges. Within just a few days, the trend reversed, with netflow falling to around -$37.5 million. While the current outflow is not extreme relative to historical swings, the rapid transition from inflow to outflow suggests that incoming liquidity was quickly deployed. According to the analysis, this movement likely connects directly to the anomalous Bitcoin outflow observed on March 4. The sequence suggests that stablecoins were first deposited onto exchanges, converted into Bitcoin through spot purchases, and then withdrawn into cold storage. Large-scale accumulators trigger this behavior, buying Bitcoin on exchanges and immediately transferring it to long-term custody. Bitcoin Tests Key Level Around $70K The 4-hour chart shows Bitcoin consolidating near the $70,000 level after a sharp recovery from the late-February lows around $63,000. Following the geopolitical-driven selloff, BTC entered a sideways structure for several weeks before breaking higher in early March and briefly reaching the $74,000 region. This move pushed the price above the short-term moving averages, signaling improving momentum. Currently, Bitcoin is testing the confluence of several technical levels near $70K. The price has pulled back from the recent local high and is now hovering around the descending 200-period moving average, which is acting as immediate resistance. The 50-period and 100-period moving averages are slightly below the current price, forming a short-term support cluster in the $68,000–$69,000 range. Related Reading: Manufacturing The Bitcoin Reserve: Inside The Trump Family’s 11,000-Miner Expansion At American Bitcoin From a structural perspective, the recent breakout shifted the market from a short-term downtrend into a consolidation phase with slightly higher lows. However, the rejection near $74,000 indicates that bullish momentum still faces overhead pressure. If Bitcoin manages to hold above the $69K support zone, the market could attempt another push toward the $73K–$74K resistance area. A decisive break above that region would confirm renewed bullish momentum. Conversely, losing the $68K support cluster could trigger another retest of the $65K–$66K range where strong buying previously emerged. Featured image from ChatGPT, chart from TradingView.com

On-chain analytics firm CryptoQuant has highlighted how its Bull Score Index is deep inside the bearish territory despite the latest Bitcoin price rally. Bitcoin Bull Score Index Has A Value Of Just 10 Right Now In a new post on X, on-chain analytics firm CryptoQuant has discussed the latest trend in the Bull Score Index for Bitcoin. This metric basically contains information about the phase of the cycle that BTC is currently inside. The indicator makes use of some of the most popular on-chain metrics to calculate its value. The list of the indicators covered by the Bull Score Index include the likes of MVRV Z-Score, CryptoQuant P&L Index, and Stablecoin Liquidity. In total, the metric accounts for the data of ten indicators, with its value representing the number of these that are giving a bullish signal for the BTC network right now. For example, the Bull Score Index having a value of 40 implies four of the metrics are bullish. Now, here is the chart shared by the analytics firm that shows how the Bitcoin Bull Score Index has fluctuated over the last year and a half: As displayed in the above graph, the Bitcoin Bull Score Index saw a spike above the 60 level back in October 2025 as the BTC price rallied to a new all-time high (ATH) . This suggests that the majority of the indicators were giving a green signal. The market unwind that followed the price surge, however, caused the Bull Score Index to plummet back into the zone below 40, corresponding to bearish conditions in the sector. By late November, the bearish signal had become so strong that the index had dropped to a value of zero. Since then, there hasn’t been any notable improvement in the indicator, with its value consistently remaining at or below 20. This hasn’t changed after the latest rally above the $70,000 level, either, as the index is still sitting at the 10 mark, implying only one metric is currently giving a bullish signal. “Bitcoin is still in a bear market despite the recent rally,” noted CryptoQuant. “The current move is likely just a relief rally, not the start of a new bull phase.” It now remains to be seen how much longer the Bull Score Index will remain inside the bearish zone. In some other news, the Bitcoin network has seen its userbase reach a new height recently, as on-chain analytics firm Santiment has highlighted in an X post . From the above chart, it’s visible that non-empty addresses on the Bitcoin network have jumped 3% over the last six months, taking their total count to a new ATH of 58.45 million. BTC Price Bitcoin climbed toward $74,000 on Wednesday, but the bullish momentum has cooled off since then as the asset has returned to $70,500.

With altcoin rallies absent, whales are profiting from shorts. But could an Ethereum breakout quickly flip the market?

The timing of the next altcoin season is one of the most debated topics in the cryptocurrency market as traders search for signs that capital could soon rotate away from Bitcoin into smaller assets. However, not every analyst believes that the next phase of the cycle will arrive soon. According to crypto analyst Hyland, investors may still see significant upside in the broader crypto market once Bitcoin turns bullish again, but an altcoin season might not materialize this year. Why An Altcoin Season In 2026 May Be Unlikely Crypto analyst Matthew Hyland, who has built a significant following on X for his crypto market takes, recently made a bold declaration : there will be no altcoin season in 2026. In his post on X, Hyland stated that there will likely be no traditional altcoin season in 2026. His reasoning is tied to how long it historically takes for altcoin dominance to recover after hitting major cycle lows. He explained that the change from the lowest point of altcoin dominance to a full altcoin season market rally typically takes between two and three years. Based on this pattern, the most recent low in altcoin dominance likely occurred around October 2025. If that timeline holds, the next major altcoin season would be expected sometime between 2027 and 2028. That means that altcoins could still spend much of 2026 in a transition period where Bitcoin keeps being the dominant driving force of price action. Even though Hyland believes the full altcoin season will not arrive this year, he pointed out that investors may still see substantial upside across the crypto market before that phase begins. Particularly, he noted that the market is currently in the max opportunity zone for long-term crypto accumulation. AltSeason Hype At Two-Year Low The most compelling supporting evidence of the current state of the altcoin season and Bitcoin dominance can be seen in crowd behavior. Recent data from the on-chain analytics platform Santiment shows that discussions about an altcoin season have cooled massively across social media platforms. According to Santiment’s social trends metrics, social mentions of the term “altseason” have dropped to a two-year low. The data tracks the weekly volume of discussions about altcoin season across major social platforms over the past two years. The chart shows that spikes in social mentions have always appeared around market peaks, when excitement about altcoin rallies is at its highest. However, this kind of sentiment trough has always acted as a contrarian buy signal. When the crowd stops talking about something, it often means the crowd has given up, and the price action of many altcoins is at yearly lows. That is precisely when the best buying opportunities tend to emerge.

Ethereum’s co-founder Vitalik Buterin has called for “bolder and more open‑minded” experimentation at Ethereum’s application layer while keeping the core principles untouched. Related Reading: Bitcoin Price Shakes Iran Fear as ETF Inflows Drive Short Squeeze Into The Vital $70K Level A Bolder Path For Ethereum In a long post on the social network X on March 5, Vitalik Buterin is doubling down on rethinking the future of Ethereum. After his warning that Ethereum should not lose itself into a memecoin-chasing and yield-farming casino, he is now asking that builders have a “more bold and open mindset to many things” referring this time especially to the “application layer and how we see ourselves in the world”. An Open Mindset Before getting into his deep dive, Buterin clarifies that this open mindset shouldn’t leave people insecure about the network’s security protocols. Ethereum’s co-founder ties back to his previous concerns regarding Ethereum’s role beyond DeFi, reminding users once again what the project ethos is about: technological and financial tools to give people more freedom. We should not compromise on core properties: censorship resistance, open source, privacy, security (CROPS). We should not have “open mindedness” of the type that leaves people with no confidence of what security properties the L1 will have one year from now “Issues of Tecnological Direction” Buterin first tackles what he calls the “technological direction” of the project. He believes that, regarding the layer of applications and Ethereum’s interface to the world, “should be willing to radically rethink various concepts and step outside our comfort zone”. Related Reading: Culper Shorts Ethereum, Says Buterin Selling Signals More Pain Ahead The first aspect to revisit should be the application stack, “because the entire stack so far has not been built around privacy”, he claims. Ethereum’s base layer is finally becoming a robust, efficient settlement engine, but the layers on top, such as L2s, wallets, DeFi, oracles and even future AI agents, are often re‑centralizing the very risks Ethereum was built to remove. Buterin calls to build radically new AI‑native, privacy‑first apps, but do it in a way that cannot override the chain’s cryptographic guarantees. “It Also Includes Culture” Then, he moves to another critique on the short-term casino culture that seems to be taking over Ethereum. Referencing the Milady NFT’s, he calls the attention out to a very specific crypto vibe: the hyper‑online, irony‑poisoned, degenerate, meme‑driven speculation. For Buterin, Milady represents an environment where attention, aesthetics and in‑group memes matter more than building tools that help people under capital controls, censorship, or real economic stress. By invoking Milady, he’s asking: are we going to keep optimizing Ethereum for this kind of self‑referential, nihilistic fun, or are we finally going to ship “sanctuary tech” that someone in a crisis would actually rely on?. He says: Yes, it’s a silly meme. Yes, I find the political takes of some milady partisans cringe and sometimes outright bootlickerish (though other milady partisans are quite the opposite). But the core underlying subtext, the message behind the message, is: rip off the suit and tie. If you have your suit and tie on, be willing to grab the nearest wine glass and spill it all over your suit and tie, so you have no choice but to rip it off and reclaim your body’s full flexibility and freedom. “How Ethereum Can Grow Back Stronger” At the end of his reflection, Vitalik Buterin makes it very clear. Recognizing the “solid position” the project now has, and all the “amazing” things Ethereum has achieved, the goal for it should no longer be searching for “the next step to make it one step better”, but to ask “what are the most valuable things to build, knowing what we know now?”. Ethereum can only grow back stronger, Buterin says, if builders treat its base layer as untouchable public infrastructure and push all the wild experimentation into AI‑native, privacy‑first apps and L2s that still inherit its full trustless guarantees. ETH's price trends to the downside on the daily chart. Source: ETHUSD on Tradingview Cover image from ChatGPT, ETHUSD chart from Tradingview

Institutional investors are holding firm through bitcoin’s latest market dip, signaling deeper conviction as ETF inflows, new buyers, and geopolitical tensions reinforce the cryptocurrency’s growing role as a potential safe-haven asset. Why Institutional Investors Aren’t Dumping Bitcoin During the Latest Dip Growing institutional participation is shaping bitcoin’s market behavior during periods of volatility. Crypto Research

BitcoinWorld Bitcoin’s Inevitable Triumph: Saylor Predicts Digital Currency Will Replace Legacy Finance Through Survival of the Fittest In a recent interview that has sparked significant discussion across financial and technological circles, MicroStrategy co-founder Michael Saylor made a bold prediction about the future of global finance. He argued that Bitcoin will inevitably replace the existing financial system through what he describes as a Darwinian process of survival of the fittest. This perspective comes at a pivotal moment when digital assets are increasingly intersecting with traditional financial infrastructure. Bitcoin as the Standard-Bearer for Financial Evolution Michael Saylor, whose company holds approximately 226,331 Bitcoin worth billions of dollars, described the cryptocurrency as the standard-bearer for what he terms the digital financial revolution. During his interview, he presented a compelling comparison between traditional financial markets and Bitcoin’s operational framework. Traditional systems, he noted, operate within constrained hours, observe numerous holidays, and face significant regulatory barriers across jurisdictions. Conversely, Bitcoin functions as a global network operating continuously without interruption. The cryptocurrency facilitates value transfer across borders 24 hours a day, seven days a week. Saylor emphasized that this constant availability represents a fundamental evolutionary advantage in an increasingly interconnected world economy. The Technical Superiority of Digital Capital Saylor’s argument centers on what he identifies as technical and operational superiority. He stated that money will eventually move at the speed of light, a capability he believes traditional systems cannot match efficiently. The Bitcoin network, with its decentralized architecture and cryptographic security, enables value transfer with significantly lower costs compared to conventional banking and financial transfer systems. Industry analysts have documented the growing efficiency of cryptocurrency transactions. According to blockchain data providers, the average Bitcoin transaction fee has decreased substantially during periods of network optimization, while settlement times remain consistently faster than many traditional international transfers. Comparative Analysis of Financial Systems The table below illustrates key operational differences between traditional finance and Bitcoin: Feature Traditional Finance Bitcoin Network Operating Hours Market hours with closures 24/7 continuous operation Cross-Border Settlement 1-5 business days typically 10 minutes to 1 hour average Global Accessibility Geographic restrictions apply Permissionless global access Transaction Costs Varies by service and amount Network-determined fees Financial technology experts note that these technical differences have practical implications. For instance, businesses operating internationally face challenges with traditional banking hours across time zones. Additionally, compliance requirements create friction in cross-border transactions that decentralized networks potentially reduce. The Darwinian Framework for Financial Systems Saylor’s use of Darwinian theory applies evolutionary principles to financial technology development. In biological evolution, organisms best adapted to their environment tend to survive and reproduce. Similarly, Saylor suggests that financial systems demonstrating superior efficiency, accessibility, and resilience will naturally prevail in the competitive landscape of global finance. Historical precedents exist for such technological displacement in finance. The transition from physical gold to paper currency, then to digital banking, demonstrates how monetary systems evolve toward greater efficiency. Each transition reduced friction in value storage and transfer, much as cryptocurrency advocates claim digital assets do today. Several factors contribute to this evolutionary pressure: Globalization: Increasing international trade requires efficient cross-border settlement Digitalization: Economic activities migrate to digital platforms needing native financial systems Financial Inclusion: Billions remain underserved by traditional banking infrastructure Security Advances: Cryptographic techniques offer new approaches to financial security Real-World Context and Current Developments The discussion about Bitcoin replacing legacy systems occurs alongside significant institutional adoption. Major financial institutions, including BlackRock and Fidelity, have launched Bitcoin exchange-traded funds (ETFs). These products bridge traditional investment vehicles with cryptocurrency exposure, potentially accelerating integration between systems. Furthermore, several countries have adopted Bitcoin as legal tender or are developing central bank digital currencies (CBDCs). These developments suggest that digital currency concepts are gaining formal recognition within existing financial frameworks rather than operating entirely outside them. Regulatory developments also shape this evolutionary landscape. The European Union’s Markets in Crypto-Assets (MiCA) regulation establishes comprehensive rules for cryptocurrency markets. Similarly, the United States is developing clearer regulatory frameworks through legislative proposals and agency guidance. Expert Perspectives on Financial Evolution Financial historians note that monetary systems have undergone multiple transformations throughout human history. The move from commodity money to representative money to fiat currency represents previous evolutionary steps. Some economists suggest digital assets might represent the next phase in this progression, though debate continues about which specific technologies will prevail. Technology analysts emphasize that network effects play a crucial role in such transitions. Bitcoin’s first-mover advantage, brand recognition, and substantial network security contribute to its position in discussions about financial system evolution. However, other cryptocurrencies and blockchain networks also compete in this space with different technical approaches and use cases. Potential Impacts on Global Financial Infrastructure The transition Saylor describes would have profound implications for financial systems worldwide. Traditional banking functions like clearing, settlement, and custody might undergo fundamental changes. Payment systems could become more efficient but might also face disintermediation challenges. Monetary policy implementation might require adaptation if digital currencies gain substantial adoption. Central banks worldwide are researching how digital assets affect their ability to manage inflation, employment, and economic stability. International organizations like the International Monetary Fund and Bank for International Settlements are studying these implications extensively. For consumers and businesses, potential benefits include: Reduced transaction costs for cross-border payments Increased financial access for unbanked populations Enhanced transparency in financial transactions Greater individual control over financial assets Potential challenges also exist, including: Regulatory compliance across jurisdictions Price volatility management Cybersecurity considerations Technological literacy requirements Conclusion Michael Saylor’s prediction that Bitcoin will replace legacy finance through survival of the fittest presents a compelling vision of financial system evolution. His argument emphasizes technical superiority, operational efficiency, and adaptive advantages as drivers of this potential transition. While the complete replacement of existing systems remains speculative, the growing integration of cryptocurrency concepts into mainstream finance suggests evolutionary pressures are indeed reshaping the financial landscape. The ongoing dialogue between traditional institutions and emerging technologies will likely determine the pace and nature of any such transformation, with Bitcoin positioned as a significant participant in this Darwinian process of financial evolution. FAQs Q1: What exactly did Michael Saylor predict about Bitcoin and legacy finance? Michael Saylor predicted that Bitcoin will eventually replace the existing financial system through a process he compares to Darwinian survival of the fittest. He argues that Bitcoin’s technical advantages—including 24/7 global operation, lower transaction costs, and the ability to move value at digital speeds—will make it prevail over slower, more constrained traditional financial systems. Q2: How does Bitcoin’s operational model differ from traditional finance? Bitcoin operates as a decentralized global network available 24/7 without holidays or geographic restrictions. Traditional financial markets have specific trading hours, observe national holidays, and face regulatory barriers between jurisdictions. Bitcoin transactions typically settle faster than many international bank transfers, especially across borders. Q3: What does “money moving at the speed of light” mean in practical terms? This phrase refers to the near-instantaneous settlement capability of digital currencies compared to traditional systems. While not literally at light speed, Bitcoin transactions can confirm within minutes globally, whereas international bank transfers often require multiple business days due to intermediary banks, time zones, and compliance checks. Q4: Are there real-world examples of financial systems evolving in this way? Yes, financial systems have evolved throughout history from commodity money (like gold) to representative money (paper backed by commodities) to fiat currency (government-issued without commodity backing). Each transition increased efficiency and reduced friction. The potential move toward digital assets represents a possible next phase in this evolutionary progression. Q5: What are the main challenges to Bitcoin replacing legacy finance? Significant challenges include regulatory frameworks that vary globally, price volatility that complicates its use as a stable medium of exchange, scalability limitations during high network demand, energy consumption concerns, and the need for broader technological adoption and understanding among the general population and institutions. This post Bitcoin’s Inevitable Triumph: Saylor Predicts Digital Currency Will Replace Legacy Finance Through Survival of the Fittest first appeared on BitcoinWorld .
BitcoinWorld Crypto Fear & Greed Index Plunges to 12: Unpacking the Alarming Extreme Fear Gripping Markets Global cryptocurrency markets are exhibiting profound anxiety as the widely watched Crypto Fear & Greed Index has plunged to a reading of 12, signaling a deepening state of ‘Extreme Fear’ among investors. This six-point drop from the previous day, reported by data provider Alternative on February 1, 2025, marks one of the most pessimistic sentiment readings in recent months and reflects growing caution across digital asset portfolios. The Crypto Fear & Greed Index Drops to a Critical Low Market analysts closely monitor the Crypto Fear & Greed Index as a crucial barometer of investor psychology. The index operates on a scale from 0 to 100, where 0 represents ‘Extreme Fear’ and 100 signifies ‘Extreme Greed.’ A reading of 12 places the market firmly in the darkest zone of the spectrum. This metric does not rely on a single data point. Instead, it synthesizes multiple market inputs to gauge the emotional temperature of participants. The index’s calculation incorporates six weighted factors: Market Volatility (25%): Heightened price swings often correlate with fear. Market Volume (25%): Trading activity and momentum. Social Media (15%): Sentiment analysis from platforms like Twitter and Reddit. Surveys (15%): Direct polling of market participants. Bitcoin Dominance (10%): Bitcoin’s share of the total crypto market cap. Google Trends (10%): Search volume for cryptocurrency-related terms. This multi-faceted approach aims to provide a holistic view beyond simple price action. The current composite score suggests negative signals across most, if not all, of these underlying components. Historical Context and Market Sentiment Trends The descent into ‘Extreme Fear’ territory is not an isolated event. According to the historical timeline from Alternative, the index first crossed into this zone on January 30, 2025, and has remained there since. This persistent negativity often creates a self-reinforcing cycle. Fearful investors may sell assets, which increases selling pressure and volatility, thereby feeding back into the index and justifying further fear. Historically, periods of ‘Extreme Fear’ have sometimes preceded significant market bottoms, presenting potential opportunities for contrarian investors. However, they also frequently coincide with sharp price corrections and periods of low liquidity. The table below shows notable historical readings for context: Period Index Reading Market Context March 2020 8 Global pandemic-induced market crash. June 2022 6 Collapse of the Terra/Luna ecosystem. January 2023 25 Post-FTX collapse recovery phase. February 2025 12 Current reading amid regulatory and macro uncertainty. This historical perspective is essential for understanding the current reading’s severity. While not at the absolute lows seen during systemic crises, a score of 12 indicates a market under significant stress. Expert Analysis on Underlying Drivers Financial psychologists and behavioral economists note that sentiment indices like this one capture the herd mentality prevalent in speculative markets. The shift from ‘Fear’ to ‘Extreme Fear’ often triggers different investor behaviors. These can include panic selling, withdrawal from riskier altcoins into stablecoins or Bitcoin, and a general retreat from the market. Several concurrent factors in early 2025 likely contributed to this sentiment plunge. Firstly, ongoing macroeconomic uncertainty regarding interest rates and inflation continues to pressure risk assets globally. Secondly, the cryptocurrency sector faces evolving regulatory frameworks in major economies, creating uncertainty. Finally, network-specific factors, such as Bitcoin’s post-halving price action and Ethereum network upgrade outcomes, contribute to sector-wide volatility. Market technicians also point to key support levels being tested across major cryptocurrencies. When these technical levels break, it often triggers automated selling and worsens sentiment metrics. The Fear & Greed Index effectively quantifies this collective emotional response to these complex, interwoven pressures. The Practical Impact on Cryptocurrency Trading An ‘Extreme Fear’ reading has tangible consequences for market structure. Trading volume often becomes skewed toward selling, and bid-ask spreads can widen as liquidity providers become more cautious. Furthermore, funding rates in perpetual swap markets frequently turn deeply negative, indicating that traders are paying to hold short positions. For long-term investors, such periods are a test of conviction and risk management. Many institutional frameworks use sentiment extremes as one input for dollar-cost averaging strategies, potentially increasing accumulation during fear phases. However, the index is not a timing tool. Markets can remain in ‘Extreme Fear’ for extended periods, as seen in prolonged bear markets. It is also critical to distinguish between sentiment and fundamentals. A pessimistic mood does not necessarily reflect the underlying health of blockchain networks, development activity, or adoption rates. This disconnect is why sentiment analysis remains a distinct field from fundamental analysis within crypto research. Conclusion The Crypto Fear & Greed Index reading of 12 serves as a stark quantitative measure of the anxiety currently permeating digital asset markets. This plunge into ‘Extreme Fear’ reflects a confluence of macroeconomic pressures, regulatory developments, and technical market breakdowns. While historically such extremes have marked emotional capitulation points, they also represent periods of high risk and potential opportunity. Market participants should view this index as a crucial gauge of crowd psychology, but must combine it with rigorous fundamental and technical analysis for informed decision-making. The index’s continued residence in this zone will be a key metric to watch for signals of a sustained shift in market sentiment. FAQs Q1: What does a Crypto Fear & Greed Index reading of 12 mean? A reading of 12 indicates the market is in a state of ‘Extreme Fear.’ This is the lowest category on the 0-100 scale, suggesting widespread pessimism, potential panic selling, and high risk aversion among cryptocurrency investors. Q2: How is the Crypto Fear & Greed Index calculated? The index is a composite score based on six factors: market volatility (25%), market trading volume (25%), social media sentiment (15%), surveys (15%), Bitcoin’s market dominance (10%), and Google search trends for crypto terms (10%). Q3: Has the index been this low before? Yes. The index reached single digits during major crises like the COVID-19 market crash in March 2020 (8) and the collapse of the Terra ecosystem in June 2022 (6). The current reading of 12 is among the lowest readings of the past few years. Q4: Is ‘Extreme Fear’ a good time to buy cryptocurrency? From a contrarian investment perspective, extreme fear can signal a potential buying opportunity, as prices may be oversold. However, it is not a guarantee of a bottom. Investors should use this data point alongside thorough fundamental research and sound risk management. Q5: How long do markets typically stay in ‘Extreme Fear’? The duration varies significantly. It can last for days, weeks, or even months during prolonged bear markets. The index entered ‘Extreme Fear’ on January 30, 2025, and its persistence will depend on changes in the underlying market drivers like price action, volume, and news flow. This post Crypto Fear & Greed Index Plunges to 12: Unpacking the Alarming Extreme Fear Gripping Markets first appeared on BitcoinWorld .
BitcoinWorld Bitcoin ETF Fund Flows Reveal Critical Negative Correlation with BTC Risk Index, Analysis Shows Cryptocurrency markets demonstrate a revealing negative correlation between institutional investment vehicles and market risk metrics, according to recent analysis from Swissblock. The firm’s comprehensive examination of Bitcoin ETF fund flows against its proprietary BTC Risk Index shows consistent inverse movement patterns that began last November. This relationship became particularly pronounced during recent market movements, offering traders and investors crucial insights into market dynamics. The analysis suggests that ETF-driven capital movements now significantly influence Bitcoin’s risk profile and price pressure mechanisms. Bitcoin ETF Fund Flows and Risk Index Correlation Swissblock’s Bitcoin Vector signal service recently published detailed findings about the relationship between spot Bitcoin ETF activity and market risk assessment. The cryptocurrency data analytics firm discovered that when capital exits Bitcoin ETFs, the BTC Risk Index typically becomes unstable. Conversely, the firm observed that net inflows into these exchange-traded funds generally correspond with declining risk index readings. This pattern has developed with remarkable consistency since November 2023, according to Swissblock’s tracking data. The analysis specifically highlights how selling pressure tends to dominate during ETF outflow periods. Meanwhile, buying pressure often emerges when institutional investment vehicles experience sustained capital inflows. Swissblock researchers documented this phenomenon occurring almost in lockstep throughout the observation period. The correlation became particularly prominent during last week’s market activity, providing clear evidence of the relationship’s strength. Understanding the BTC Risk Index Mechanism The BTC Risk Index functions as a proprietary metric developed by Swissblock to quantify market sentiment and potential volatility. This analytical tool incorporates multiple data points to generate its readings. The index specifically measures: Market sentiment indicators from social media and news analysis Price volatility metrics across multiple timeframes Trading volume patterns and their distribution Derivatives market positioning and leverage levels On-chain transaction flows between different holder categories When the index rises above certain thresholds, it signals increasing market risk and potential price instability. Lower readings typically indicate more stable conditions with reduced volatility expectations. The index has gained recognition among institutional traders as a reliable risk assessment tool since its introduction. ETF Market Development Timeline The relationship between ETF flows and risk metrics emerged following significant regulatory developments. The United States Securities and Exchange Commission approved multiple spot Bitcoin ETFs in January 2024 after years of consideration. This regulatory milestone created new pathways for institutional capital allocation to cryptocurrency markets. Major financial institutions including BlackRock, Fidelity, and Ark Invest launched competing products almost simultaneously. These investment vehicles quickly accumulated substantial assets under management, establishing themselves as significant market participants. Their trading activity now represents a measurable portion of daily Bitcoin volume. The table below illustrates key milestones in this development: Date Event Significance November 2023 Initial correlation patterns emerge Swissblock observes early inverse relationship January 2024 Spot Bitcoin ETF approvals Multiple products launch simultaneously March 2024 Record ETF inflows recorded Correlation strengthens with increased volume April 2024 Analysis period concludes Swissblock publishes comprehensive findings Market Impact and Trading Implications The discovered correlation carries significant implications for market participants across different categories. Institutional investors now monitor ETF flow data alongside traditional market indicators. Retail traders increasingly incorporate these metrics into their decision-making frameworks. The relationship suggests that ETF activity serves as both a leading indicator and concurrent signal for market risk conditions. Swissblock’s analysis specifically indicates that sustained ETF inflows could potentially drive the BTC Risk Index to 25 or below. Such development would likely create market conditions where buying pressure assumes control. Conversely, extended outflow periods might elevate risk readings substantially. This dynamic creates new analytical opportunities for market participants seeking to anticipate volatility shifts. Expert Perspectives on Correlation Significance Market analysts emphasize the importance of understanding this relationship within broader financial contexts. The correlation demonstrates how traditional investment vehicles increasingly influence cryptocurrency market dynamics. This development represents a maturation phase for digital asset markets as they integrate with conventional financial systems. Financial researchers note that similar relationships exist in traditional markets between fund flows and volatility indices. The appearance of this pattern in cryptocurrency markets suggests increasing structural similarities. This development potentially indicates growing market efficiency and institutional participation levels. However, analysts caution that correlation does not necessarily imply causation in all market conditions. Broader Cryptocurrency Market Context The ETF-risk correlation emerges during a period of significant cryptocurrency market evolution. Regulatory frameworks continue developing across multiple jurisdictions simultaneously. Institutional adoption accelerates while retail participation maintains steady growth. Market infrastructure improves through technological advancements and service provider expansion. This specific analysis contributes to understanding how new financial products influence established market metrics. The findings help market participants navigate increasingly complex investment landscapes. They provide empirical evidence about the interconnected nature of modern cryptocurrency markets. Furthermore, the analysis offers practical insights for risk management and portfolio construction strategies. Conclusion Swissblock’s analysis reveals a significant negative correlation between Bitcoin ETF fund flows and the BTC Risk Index. This relationship demonstrates how institutional investment vehicles increasingly influence cryptocurrency market dynamics and risk assessment. The findings provide valuable insights for traders, investors, and analysts navigating evolving market conditions. As cryptocurrency markets continue maturing, understanding these correlations becomes increasingly important for informed decision-making. The Bitcoin ETF and risk index relationship represents a crucial development in market analysis methodologies. FAQs Q1: What is the BTC Risk Index? The BTC Risk Index is a proprietary metric developed by Swissblock that quantifies market sentiment and potential volatility using multiple data points including social media analysis, price volatility, trading volume patterns, derivatives positioning, and on-chain transaction flows. Q2: How do Bitcoin ETF fund flows affect the risk index? Analysis shows a negative correlation where ETF outflows correspond with rising risk index readings and increased selling pressure, while ETF inflows correspond with declining risk index readings and potential buying pressure dominance. Q3: When did this correlation pattern begin? Swissblock’s analysis indicates the correlation emerged in November 2023 and strengthened following spot Bitcoin ETF approvals in January 2024, becoming particularly prominent in recent market activity. Q4: What are the practical implications for traders? Traders can use ETF flow data as a complementary indicator alongside the risk index to anticipate potential volatility shifts and market pressure directions, though correlation doesn’t guarantee causation in all conditions. Q5: How might continued ETF inflows affect the market? Sustained ETF inflows could potentially drive the BTC Risk Index to 25 or below, creating conditions where buying pressure might dominate market movements according to Swissblock’s analysis. This post Bitcoin ETF Fund Flows Reveal Critical Negative Correlation with BTC Risk Index, Analysis Shows first appeared on BitcoinWorld .

CleanSpark sold most of its mined Bitcoin in February, generating over $36 million in revenue. The company is investing these profits in artificial intelligence and data center infrastructure. Continue Reading: CleanSpark Pivots Bitcoin Mining Profits Toward AI and Data Center Ventures The post CleanSpark Pivots Bitcoin Mining Profits Toward AI and Data Center Ventures appeared first on COINTURK NEWS .

Exhausted sellers may be giving Bitcoin some breathing room — but analysts say that’s a long way from a recovery. Related Reading: SEC Vs. Justin Sun Case Ends In $10M Settlement, Traders Eye TRX Price Reaction US Buyers Return, Pushing Prices Off Multi-Week Lows Data from on-chain analytics firm CryptoQuant shows the Coinbase Bitcoin Premium — a measure of US-based buying demand — has flipped from its most negative readings in early February to its highest point since October. That shift helped carry Bitcoin to a one-month high of $74,000 on Thursday, briefly touching the 50-day exponential moving average. It didn’t last. By Friday morning, the price had dropped more than $3,000, sliding back below $71,000 as momentum faded almost as fast as it built. The rally came alongside a wave of ETF inflows and what Nick Ruck, director of LVRG Research, called “renewed risk appetite.” But even as buyers stepped in, the broader conditions hadn’t changed. Ruck said that the advance “quickly faced headwinds,” with macro uncertainty and softer economic signals pulling the market back down. Bitcoin is still in a bear market despite the recent rally. Our Bull Score Index remains at 10/100, deep in bearish territory. The current move is likely just a relief rally, not the start of a new bull phase. pic.twitter.com/bh4O6jQPD6 — CryptoQuant.com (@cryptoquant_com) March 5, 2026 Bear Market Indicators Remain At Historic Lows CryptoQuant’s Bull Score Index — a composite reading of Bitcoin’s technical and fundamental health — sits at just 10 out of 100. That places it, by the firm’s own assessment, deep in negative territory. Reports from the firm say the number hasn’t moved despite the recent price action. “Even after the recent price rally, fundamental and technical indicators still point to a bear market environment,” CryptoQuant stated Thursday. The firm was blunt about what the brief climb likely represents: a short-term release of pressure, not a turning point. Unrealized losses among traders and long-term holders had reached levels last seen in July 2022 before the recent easing. That kind of exhaustion can slow a slide without reversing it. One signal pointing to easing pressure emerged Friday, when analysts said market momentum appears to be approaching a “critical shift.” According to their assessment, Bitcoin may be moving out of a phase marked by peak negative momentum — a stage that has often preceded broader changes in market direction. What follows that shift, and how quickly it unfolds, remains uncertain. Related Reading: Solana Stablecoins Hit $650 Billion In Monthly Transactions Macro Headwinds Keep A Lid On Any Optimism February nonfarm payrolls data, expected to show a slowdown, loomed as an added weight on sentiment. Analysts pointed to those “softer macro signals” as a reason cryptocurrencies remain open to fresh downside. Liquidity conditions had been supportive enough to spark the relief move, but not strong enough to sustain it. Bitcoin’s brief climb above $74,000 drew attention. The pullback drew more. With the Bull Score Index anchored near the floor and macro conditions still unsettled, analysts are watching for whether US buying demand holds — or fades just like the rally did. Featured image from Defenders of Wildlife, chart from TradingView

Ethereum has had a pretty wild couple of weeks, which has been fueling bullish price predictions . Price bounced hard from the late February lows, jumping from around $1,830 to nearly $2,200 before cooling off again. Since then, ETH has been hovering just above the $2,000 level, and that area is starting to draw a lot of attention. Some hesitation is coming from a bearish divergence that recently appeared on the chart. That signal has sometimes warned of deeper pullbacks in the past, so traders are watching it closely. Normally, that kind of setup would make the market cautious. But this time, some major players seem to be reacting very differently On-chain data shows something interesting happening around the $2,000 level. Several key groups appear to be stepping in at the same time. Large wallets have been quietly adding ETH during the pullback. Long-term holders are increasing exposure instead of reducing risk. Even derivatives traders are still leaning heavily long. Source: Santiment What stands out is that all of them seem focused on the same price area. Cost-basis data shows a major cluster of ETH last moved around the $2,000 zone. That means many holders are sitting near their entry price, which often gives them a strong reason to defend the level. Ethereum Price Prediction: Can $2,000 Hold as the Market’s Key Support? With whales accumulating, long-term holders adding exposure, and leveraged traders positioning around the same area, the $2,000 zone has become one of the most closely watched levels for Ethereum in the short term. Technically, Ethereum is starting to squeeze into a tight structure after its sharp rebound from the February lows. Source: ETHUSD / TradingView Price pushed up toward the $2,200 resistance but could not break it. That created a lower high while the rising trendline below keeps lifting price. The result is a tightening wedge where the range keeps getting smaller. Right now, everything revolves around $2,000. That level has already attracted heavy interest from whales and long-term holders. As long as ETH holds above it, the overall structure still looks constructive. The upside trigger sits near $2,200. If Ethereum breaks and holds above that level, the wedge likely resolves higher. That could open the path toward $2,400 and possibly $2,750 if momentum expands. But if $2,000 gives way, the picture changes. The next demand zones appear around $1,850 and then $1,750. New Layer 2 Presale Raises Millions to Bring Solana Technology to Bitcoin Bitcoin has one annoying issue. It is powerful, secure, and trusted, but it moves at the speed of a sleepy turtle. That is why most people treat it like a digital trophy. They buy it, stare at the chart, and hope the next candle finally turns green. Bitcoin Hyper ($HYPER) is trying to flip that whole dynamic. Instead of letting Bitcoin sit there like a passive asset, the project wants to unlock what it can actually do. The idea is simple. Take the security that made Bitcoin the king of crypto and combine it with the speed and efficiency you normally see on networks like Solana. Suddenly, it is not just about holding. Think faster payments, staking opportunities, apps, and real activity happening on top of Bitcoin instead of endless speculation about the price. Investors are clearly paying attention. The presale has already raised more than $32 million, with $HYPER currently priced at $0.0136751 before the next price increase kicks in. There is also a strong incentive for early believers. Buyers can stake their tokens and earn rewards of up to 37% , the kind of yield that tends to attract early momentum when traders start looking for the next project gaining traction. To buy HYPER before it lists on exchanges, simply visit the official Bitcoin Hyper website and connect a wallet (such as Best Wallet ). Visit the Official Bitcoin Hyper Website Here The post Ethereum Price Prediction: Whales Are Defending Critical $2,000 Level — Is ETH About to Explode Higher? appeared first on Cryptonews .


Bitcoin Strategist Joe Burnett has shared an ambitious long-term outlook for the BTC price that puts the world’s largest cryptocurrency in the eight-figure range. The projection comes from a research report published on Substack that discusses how major technological and economic shifts could reshape global markets. While the projected price target is bold, Burnett’s reason behind it has drawn significant attention. BTC Price Forecasted To Hit $11 Million In 10 Years Burnett has predicted that Bitcoin could climb to roughly $11 million per coin by 2036 if it captures a meaningful share of global financial wealth . The crypto strategist’s ambitious forecast is an updated outlook that builds on a prior thesis he introduced last year, which pointed to a $10 million target by 2035. His new report suggests the structural conditions and reasons supporting that earlier call have not weakened but have actually grown stronger over time. Burnett’s $11 million Bitcoin price projection assumes that global financial assets will continue to expand over the next decade while BTC gradually strengthens its role as a long-term store of value. In this scenario, Bitcoin’s total market capitalization could reach $230 trillion within a decade. With global financial assets expected to approach $2 quadrillion by 2036 if they continue compounding at historical rates, Burnett argues that a $230 trillion valuation would represent only a modest portion of that global wealth. This means Bitcoin would not need to replace existing traditional financial systems to reach such levels. It would simply need to become the most reliable store of value in a world where traditional safe-haven assets are losing their edge. Burnett’s thesis also focuses on Bitcoin’s fixed supply of 21 million BTC and its growing appeal among investors seeking protection against currency debasement. As confidence in scarce digital assets grows, he expects more capital to shift toward Bitcoin as a long-term savings vehicle, potentially fueling its price growth. The AI Deflation Engine Behind The Bitcoin Prediction A key part of Burnett’s argument centers on the economic impact of artificial intelligence (AI) . He noted that rapid improvements in AI could increase productivity across industries and significantly lower the cost of producing goods and services. This type of technological prowess can create strong deflationary pressure in the financial economy. When prices fall due to efficiency gains, policymakers often respond with monetary expansion to stimulate growth and maintain financial stability. Burnett emphasized that increased liquidity in the financial system could also encourage investors to move toward assets with verifiable scarcity. He noted that Bitcoin stood out in that environment because its supply is permanently capped, making it relatively resistant to the inflation that affects traditional currencies. The report also points to the potential development of new financial products built around Bitcoin reserves. According to Burnett, lending and credit structures backed by large BTC holdings could bring additional institutional capital into the ecosystem while reinforcing its role as a global reserve asset . Burnett believes these structural forces could unfold gradually over the next decade. If they do, the crypto strategist stated that Bitcoin’s rise would be less driven by speculative enthusiasm and “belief” and more by long-term shifts in deflationary pressure, monetary and liquidity expansion, and global capital allocation.

Bitcoin’s price volatility tends to scare off buyers, but data shows investors who hold for at least three years have a higher chance of locking in significant returns.

The price of Bitcoin is almost hit $74,000 this week despite escalating tensions between the United States and Iran, suggesting that crypto markets may have already absorbed the geopolitical risk. Meanwhile, pro-crypto circles believe the eventual approval of the U.S. CLARITY Act could light the fuse on a 2026 bull run If that scenario unfolds, the three largest cryptocurrencies could see the biggest gains. Discover: The best meme coins in the world right now. XRP (XRP): Ripple’s Payments Network Could Reach $5 Soon XRP ($XRP) capitalizes $83 billion of the market, making it the biggest blockchain solution for cross-border payments. Ripple developed the XRP Ledger (XRPL) to enable near-instant transactions with extremely low fees, offering a protocol that could one day replace SWIFT. The company recently doubled down on efforts to turn XRPL into a foundation for stablecoins and tokenized real-world assets while maintaining XRP as the ledger’s primary liquidity asset. Both the United Nations Capital Development Fund and the White House have praised Ripple’s technology as next generation payment infrastructure. The recent approval of spot XRP exchange-traded funds (ETFs) in the United States has broadened access traditional investors. From a technical perspective, XRP appears to be forming a bullish flag pattern on the charts. If macroeconomic and industry conditions remain supportive, the token could hit $5 during H1. Bitcoin (BTC): Could the Crypto Pioneer Reach a New Record by Summer? Bitcoin ($BTC) previously surged to an all-time high of $126,080 on October 6. However, that rally was followed by a significant correction as geopolitical tensions and speculation about possible U.S. military involvement related to Iran and Greenland weighed on investor sentiment. The downturn erased nearly half of Bitcoin’s value, briefly pushing prices down to around $63,000 last weekend. However, Bitcoin’s reputation as “digital gold” continues attracting investors seeking protection against inflation, currency devaluation, and broader economic uncertainty. Rising institutional demand, reduced supply following the latest halving, and expectations for clearer regulatory guidance in the United States will be key price drivers this year. Additionally, if Donald Trump delivers his promise for a U.S. Strategic Bitcoin Reserve, Bitcoin could be centre stage for years to come. Ethereum (ETH): The Core of DeFi Targets New Highs Ethereum ($ETH) powers the biggest share of the decentralized finance sector and has a $239 billion market cap. The network currently secures roughly $55 billion TVL (TVL), making it the most active ecosystem for on-chain finance and commerce. If market conditions improve, Ethereum could test the $5,000 resistance level as early as June, potentially surpassing its last August’s historic peak of $4,946. Over the longer term, Ethereum’s path toward five-figure valuations will depend heavily on regulatory clarity in the United States and favorable macroeconomic trends. Passage of the CLARITY Act could accelerate institutional deployment of stablecoins and tokenized real-world assets on Ethereum. Technically, ETH is attempting to invalidating a bearish pennant formation that emerged throughout February. For long-term investors, current price levels could represent an attractive accumulation opportunity. Bitcoin Hyper: A Low-Cost Crypto Presale Bringing Solana-Level Speed to Bitcoin Although Bitcoin, XRP, and Ethereum offer strong long-term investment narratives, the largest and quickest percentage gains in crypto markets have historically come from early exposure to new and revolutionary projects. Bitcoin Hyper ($HYPER) expands Bitcoin’s capabilities by introducing Solana-style speed and efficiency through a Layer-2 scaling solution. It reduces transaction costs while preserving the security of the Bitcoin network. With Bitcoin Hyper, users can stake tokens, earn yield, trade assets, and access smart contract functionality without transferring funds away from the Bitcoin ecosystem. The project has already raised $31.8 million through its ongoing presale, attracting growing attention from large investors and cryptocurrency exchanges. As a result, $HYPER is quickly becoming one of the most closely monitored crypto launches of the year. Investors interested in securing $HYPER at its fixed presale price can visit the official Bitcoin Hyper website and connect a supported wallet such as Best Wallet . Tokens can also be purchased using a bank card. Visit the Official Website Here The post Crypto Price Prediction Today 6 March – XRP, Bitcoin, Ethereum appeared first on Cryptonews .

Shiba Inu is showing renewed strength after defending a key support level during recent market volatility. The meme coin now shows early signs of recovery as broader crypto momentum improves. Analysts say the latest price reaction could open the path for a short-term rebound. Shiba Inu Reclaims Support After Brief Decline Shiba Inu recently tested a crucial support zone before quickly rebounding, according to market analyst SwallowAcademy. The analyst said the token retested a local bottom between $0.00000544 and $0.00000520 on the one-hour timeframe. Earlier analysis outlined two potential scenarios. One scenario suggested a bounce from the $0.0000055 support region. However, that outcome did not materialize immediately as bearish pressure pushed prices lower. The decline on March 5 forced Shiba Inu to revisit the deeper local support area. Despite the drop, the token did not remain there long. Buyers stepped in quickly and lifted the price back above the $0.0000055 demand zone. SwallowAcademy noted that the recovery aligns with the second scenario outlined in Thursday’s analysis. According to the analyst, the swift rebound signals strengthening momentum on lower timeframes. Shiba Inu had shown moderate growth earlier in the week. The token rose 4% on March 4, reaching an intraday high of $0.00000586. It later closed around $0.00000570. However, the rally did not last. The following day brought renewed selling pressure. A 3% drop pushed the price back toward $0.0000055. Meanwhile, the broader crypto market showed improving sentiment. Bitcoin climbed above $68,000, a level last seen in early February. Shiba Inu followed the trend but delivered a smaller gain compared to Bitcoin. Analysts Outline Potential Uptrend Targets SwallowAcademy’s chart analysis highlighted measured price targets following the successful support retest. The first resistance target stands at $0.00000586. This level matches the intraday high recorded on March 3. At the current market price of $0.00000558, Shiba Inu sits about 5% below that level. The analyst said a break above that resistance could open the path toward a second target at $0.00000644. That move would represent a 15.6% increase from the current price. The $0.00000644 level also aligns with the area where Shiba Inu peaked on February 26. Analysts often view such levels as key resistance zones. SwallowAcademy described these objectives as smaller targets on the lower timeframe chart. The analyst suggested that stronger bullish momentum could develop on higher timeframes. Previous analysis from the same commentator projected a potential move above $0.0000085. The forecast relied on a bullish chart formation that may emerge if momentum continues. However, the analyst cautioned that the scenario remains uncertain. Bears still hold considerable influence over the market structure. For now, Shiba Inu’s next move depends on broader crypto conditions. Sustained market strength could help the token push toward the outlined resistance levels.
Bitcoin sold off below $70,000 on Friday, leading analysts to conclude that this week’s breakout to $74,000 was a relief rally rather than a longer-lasting sign of a trend change.
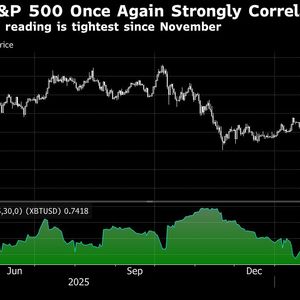
Bitcoin is once again moving closely in step with US stocks, at just about the worst time for crypto diehards.

More on crypto stocks BTC: Grayscale's Bitcoin ETF Challenging The Major Asset Management Firms IBIT: It Makes Sense To Take A Bite Tracking Cathie Wood's ARK Invest 13F Portfolio - Q4 2025 Update Bitcoin slips below key level as investors brace for U.S. jobs data, Middle East tensions rise Bitcoin tops $73K and hits a fresh one-month high as momentum builds
Bitcoin slipped toward $68K while Ethereum dropped below $2K, triggering broader losses across the crypto market as key resistance levels held.

Institutional interest continues to grow, but a stronger dollar and shifting interest rate expectations are keeping a lid on the latest rally.

Bitcoin’s impressive price surge to $74,000 earlier this week came to a somewhat expected halt, and the asset has lost $6,000 since then, dropping to and under $68,000 today. The latest price slip came after the US jobs report that came out on Friday and Trump’s new set of threats against Iran and Cuba. The report, published earlier today, indicated that the country lost 92,000 jobs in February and the unemployment rate rose to 4.4%. This meant that the nation’s labor market had lost steam last month, which contrasted with experts’ expectations. Most anticipated before the report went out that the US had gained around 60,000 jobs last month. The second reason behind the price correction today could be linked to the new remarks from the POTUS. At first, he threatened Cuba, indicating that the country’s regime is “going to fall pretty soon.” He added that the US is currently focused on the war against Iran, but they want to make “a deal badly” and suggested that Marco Rubio could handle the negotiations with Cuba. Additionally, while weighing in on the situation with Iran, Trump said there will be no deal with the Middle Eastern country. Instead, he wanted “unconditional surrender.” The analysts from the Kobeissi Letter, though, outlined a similar development last year when the US attacked Iran again. At the time, the POTUS made the same strong statement on his social media platform, but the two sides made a deal just six days later. Today, President Trump called for Iran’s “unconditional surrender.” The last time we saw this happen was on June 17th, 2025. 6 days later, on June 23rd, a ceasefire was announced. Will history repeat itself on March 12th? pic.twitter.com/2NxZ6rxBKY — The Kobeissi Letter (@KobeissiLetter) March 6, 2026 Unlike BTC, which is down by 4% in the past 24 hours, US oil prices have skyrocketed in the past several hours after Trump’s statements, going past $92 per barrel. USOIL now trades at its highest levels since September 2023. The post Why Is Bitcoin’s Price Down 4% to $68K Now? appeared first on CryptoPotato .
Profit-taking by short-term Bitcoin traders accelerated the BTC drop below $70,000, but spot and futures traders may kickstart a quick recovery.

A major narrative that is making serious waves in the entire cryptocurrency sector is the fact that the Bitcoin price may have reached a bottom. In the midst of this persistent speculation about the leading crypto asset, a key metric is taking the spotlight, providing insights regarding whether BTC has reached a bottom. Why Bitcoin May Have Hit A Bottom While the price of Bitcoin has experienced a slight rebound, discussions about whether the flagship crypto asset has hit a bottom are turning in the sector at a rapid rate. Crypto Tice, a market expert and investor, has outlined that a key BTC metric has historically determined the price bottom. After a brief bounce, Bitcoin may be showing early signs of stabilization, as the Bitcoin Total Supply in Profit metric presently indicates that the market may be nearing or has already achieved a local bottom. The indicator is starting to flash indications that have historically been linked to times of tiredness in selling activity after weeks of continuous downside pressure and unsettled confidence throughout the cryptocurrency sector. According to Crypto Tice, BTC has hit the bottom, and crypto participants have failed to see it. Looking at the data from the metric, the crypto king has officially shifted into historical bottom territory, marking an important moment for the market as a whole. Extreme levels of these indicators may indicate times when supply is being absorbed by stronger hands, and panic selling starts to diminish. Currently, supply at a loss is peaking, weak hands have been flushed, long-term holders are not selling, and liquidity is compressing. Crypto Tice stated this is not subtle or speculative; it is structural capitulation and accumulation in real time. Furthermore, when supply flips from loss-heavy to profit-ready zones, the expert highlighted that markets do not drift; they undergo an explosive upward move. As a result, the expert sees the current structure as an ideal opportunity to enter the market, calling it a “once-in-a-cycle entry point.” Bitcoin is approaching a moment that will spur the next breakout, and doubters will be watching on the sidelines. BTC Traders Are Leaning Toward A Defensive Side Technical analyst and host of the Crypto Banter show, Kyle Doops, shared on the X platform that the Bitcoin tape looks a bit split right now. The expert analysis is based on the Funding Rates, which seem to have been in a negative direction. Data shows that the BTC Funding rates are still in the negative zone, meaning that futures traders are constantly leaning toward a defensive side. However, at the same time, the Coinbase Premium Gap just experienced an upswing. It is worth noting that BTC is now trading higher on Coinbase than on other crypto exchanges. Such a scenario often implies that investors in the United States , both retail and institutional, are stepping up. In the meantime, derivatives are still cautious, and spot buyers are quietly picking some up.

Data of the Bitcoin URPD shows a supply chasm exists between $72,000 and $81,000, potentially making resistance in the region relatively light. Bitcoin URPD Signals Air Gap Until $81,000 In a new post on X, analyst Ali Martinez has talked about how Bitcoin support and resistance levels are looking from the perspective of the UTXO Realized Price Distribution (URPD). This indicator tells us about the amount of supply that was last transacted or purchased at the various price levels that BTC has visited in its history. Related Reading: Bitcoin Spot ETFs See 14-Day Netflows Surge: Demand Returning? Below is the chart shared by Martinez that shows the URPD for Bitcoin as it currently stands. From the graph, it’s visible that the levels between $60,000 and $70,000 hold the cost basis of a notable amount of the supply. The $67,000 mark, in particular, has a huge value on the URPD. Earlier, the bearish price action had meant that Bitcoin slipped all the way to the $60,000 level. What had followed the decline was a consolidation period in the region below $70,000. As the price moved sideways here and trading occurred, supply saw repricing into levels falling inside the range, which is potentially why the region is now looking so dense on the URPD. This week, Bitcoin has finally seen a breakout above $70,000, meaning that it’s now past the dense zone. As is apparent from the chart, the nearby levels in the up direction only hold a relatively small share of the supply. Generally, when the market mood is bearish, investors in loss can react to surges to their acquisition level by exiting the market. They may do so fearing that the price rally is only temporary and that they could fall underwater again. Due to this, large levels of the URPD that are situated above the spot price can act as potential centers of resistance in the future. Since the $72,000 to $81,000 price range is relatively thin with supply right now, it may not provide too much resistance to Bitcoin. As the analyst explains, “if momentum builds, there is open air in that range.” For momentum to build, the support levels below might have to hold first. Just like how large supply zones above can provide resistance, those below can act as support cushions instead. This happens as investors accumulate more to defend their acquisition level. Related Reading: Bitcoin Surge To $74,000 Fueled By US Institutions, Coinbase Premium Signals As the Bitcoin market sentiment has been quite bearish recently, it remains to be seen whether dips into the supply cluster at $70,000 and below will be met with buying. BTC Price At the time of writing, Bitcoin is trading around $70,500, up 4% over the past week. Featured image from Dall-E, chart from TradingView.com

More on Bitcoin USD, Ethereum USD Whale's Insight: From Conflict Shock To Liquidity Return - Is Crypto Forming A Base? Every Metric Screams Buy - So Why Is Bitcoin Still Falling? Weekly performance: Bitcoin pulls back after $74,000 rally Bitcoin slips below key level as investors brace for U.S. jobs data, Middle East tensions rise BlockFills withdrawal halt stirs memories of 2022 crypto bear market

The crypto research firm Santiment has identified network data indicating that Bitcoin adoption is rising despite the market’s weakened state. Santiment’s findings revealed that not only is Bitcoin adoption rising, but cold storage is increasing as well. Investors are increasingly sending their bitcoins (BTC) to offline storage platforms, a pattern usually seen among users who intend to hold for the long term. Bitcoin Adoption is Rising According to Santiment’s tweet, the number of separate non-empty wallets on the Bitcoin network has climbed to an all-time high of 58.45 million. This metric witnessed a 1.69 million rise in six months, reflecting a 3% uptick. Such growth indicates that more investors have been buying and holding BTC over the last few months, regardless of the decline in prices and the widely-believed onset of the bear market. In addition, the amount of BTC on known exchange wallets has plummeted to its lowest level since December 2017. Currently, such wallets hold only 1.17 million BTC. The rising adoption and the move to offline storage reflect a “buy the dip” trend among investors. Both retail and institutional investors have been accumulating the digital asset; however, at an insignificant pace. It also appears institutional investors have been accumulating more than their retail counterparts. Earlier this month, CryptoPotato reported that last week, U.S. spot Bitcoin exchange-traded funds (ETFs) recorded their first major accumulation wave since mid-October 2025, while retail flows declined. As ETF inflows totalled $1.45 billion on February 25, data shared by analysts showed a $5 billion contraction in retail inflows over the 30-day period from February 6 to March 2. Genuine Accumulation Drives Spot Demand Meanwhile, spot demand is also climbing amid war tensions. Despite geopolitical uncertainty shaking markets, unleveraged investors and institutions are still buying. A part of the demand can also be traced to U.S. investors, as seen in the Coinbase Premium, which flipped positive after a long negative streak. Data from the derivatives market also shows that the demand is not driven by speculative activity stemming from leveraged trades, but by genuine accumulation. This spot demand has pushed BTC back above $70,000 for the first time in three weeks. At the time of writing, the leading crypto asset was trading around $70,560, down slightly over the past 24 hours. The post Bitcoin Adoption and Offline Storage on the Rise Despite Weak Market Conditions (Santiment) appeared first on CryptoPotato .

Institutional selling pressure on Bitcoin has eased, but buying demand remains faint for now. Recent attempts at a price rally fell short, underscoring the market’s lingering fragility. Continue Reading: Institutional Sellers Step Back as Bitcoin Faces Renewed Volatility The post Institutional Sellers Step Back as Bitcoin Faces Renewed Volatility appeared first on COINTURK NEWS .

Bitcoin (BTC) showed mixed signals on Monday, trading in a narrow sideways range as investors absorbed a fresh wave of market developments.
Crypto analysts have noted that Bitcoin (BTC) is repeating a rare pattern that occurred between 2018 and 2019.

Bitcoin surrendered its $70,000 support level, triggering a broader crypto market retreat that wiped out $329 million in leveraged positions. This downturn was fueled by a perfect storm of geopolitical and macroeconomic pressures. Wiping out the ‘War Gains’ Bitcoin’s midweek resilience crumbled Friday, March 6, as the cryptocurrency surrendered the psychological $70,000 stronghold. After a

Bitcoin's Inter-exchange Flow Pulse returns to bullish after spending a year in a slump. Historic patterns show the IFP signal often precedes market rallies, but caution is required. Continue Reading: Bitcoin’s Inter-Exchange Flow Pulse Signals Fresh Upturn After Year-Long Slump The post Bitcoin’s Inter-Exchange Flow Pulse Signals Fresh Upturn After Year-Long Slump appeared first on COINTURK NEWS .
Bitcoin bounced back this week as stablecoin inflows surged, and DeFi faced fresh pressure from Aave governance strife, exploits and exchange security moves.

In 2026, the cryptocurrency scene in Latin America is about to reach a new stage as institutional players become more aware of the region's possibilities. The market is transcending its conventional retail-driven model as banks, asset managers, and fintechs start to invest cash and infrastructure. Although policy divergence remains a significant issue among nations, regulatory frameworks are also emerging, providing clearer advice for asset management and compliance. According to a new Go Markets report, LATAM is being viewed through an institutional, strategic lens and is no longer just a speculative playground. Digital alternatives are now supplementing traditional financial infrastructure, which has historically underserved a large portion of the population. Adoption of cryptocurrency is becoming more closely associated with useful financial solutions rather than just speculative trading, such as corporate treasury management, stablecoin payments, and cross-border transfers. Diverse adoption patterns across the region Latin America's adoption of cryptocurrency is still very diverse. With regulated exchanges, ETFs, and corporate strategies now commonplace, Brazil and Mexico are at the forefront of institutional adoption. While fintech companies like Nubank encourage customers to retain stablecoins like USDC, Brazil's Virtual Assets Law and the recently implemented Travel Rule are influencing market participation in 2026. Mexico continues to promote an expanding professional cryptocurrency ecosystem by utilizing its Fintech Law framework from 2018. Cryptocurrency is still used as a hedge against local currency volatility in other nations, such as Venezuela and Argentina. In the meantime, yield-focused markets are beginning to emerge in Peru and Colombia, where regular investors are looking for returns that aren't accessible from conventional savings accounts. Because blockchain solutions drastically lower the costs for migrant workers sending money home, remittances continue to be a major driver. With cryptocurrency alternatives, transaction fees typically decrease from 6.2% with traditional systems to less than 0.1%, giving millions of households real financial relief. Institutional infrastructure gaining traction The entrance of institutional-grade infrastructure is transforming the market landscape. Crypto Finance Group, a division of Deutsche Börse Group, entered LATAM at the beginning of 2026 to offer trading and custody services to asset managers and banks. Centralised exchanges such as Mercado Bitcoin, NovaDAX, and Binance have jointly opened over 200 BRL-denominated trading pairs since 2024, facilitating smoother involvement for local and international investors. Corporate adoption is also increasing; as a result of its innovative Bitcoin accumulation approach, Brazil's Meliuz currently possesses 320 BTC. The bottom-up, retail-driven growth that characterized LATAM's cryptocurrency markets has changed as a result of these events. Although regulatory differences and nation-specific policies continue to present challenges, institutional adoption offers a layer of stability and suggests that the industry may be ready for sustainable growth. 2025 performance offers background For comparison, Latin America generated over $730 billion in bitcoin volume in 2025, roughly 10% of all cryptocurrency activity worldwide and a 60% year-over-year growth. A large portion of this adoption was driven by stablecoins, which accounted for $324 billion of the entire volume. Brazil and Argentina were particularly active. The region's monthly active user base increased by 18% in 2025, demonstrating the continued need for digital assets as useful financial tools rather than only speculative ones. Brazil's legislative structure and record volumes prepared the ground for the institutional drive in 2026. While the underlying economic drivers, financial exclusion, currency instability, and reliance on remittances, remain as relevant today as they were in 2025, Latin America's cryptocurrency market is generally changing from a necessity-driven ecosystem into a more sophisticated, institutionalized infrastructure. The post Why institutions are suddenly eyeing Latin America’s crypto market appeared first on Invezz
In a Cointelegraph interview, Arthur Hayes explains why global markets may not be pricing in a longer war in the Middle East, and what that may mean for energy prices, liquidity and Bitcoin.

Bitcoin’s recent break above $70,000 is leading to questions of whether this is the start of a new impulsive leg higher or just another stop in a longer bottoming process. Crypto analyst CrypFlow, posting on X, laid out a technical case for why Bitcoin may be in the early stages of forming a major cycle bottom and why October 2026 could mark the launchpad for the next full-scale bull run. The analysis is based on multi-year trendlines, cycle behavior, and the Stochastic RSI indicator. Bitcoin Is Respecting Trendline That Has Held Since 2018 Technical analysis of Bitcoin’s price action on the monthly timeframe shows that the leading cryptocurrency’s price action is still respecting a multi-year trendline that has quietly shaped Bitcoin’s biggest cycle lows. That ascending trendline connects the 2018 cycle bottom with the 2022 bottom and now appears to be acting as support again in 2026. Bitcoin’s current position is now sitting right on top of that structure. Related Reading: Bitcoin Just Flashed Death Cross That Has Led To Previous Bottoms, But What’s The Target? CrypFlow also pointed to a major horizontal zone that previously acted as resistance around the 2021 cycle top. That old ceiling around $69,000 is now being tested as support in the current price action. That kind of role reversal is very important for Bitcoin’s price action, because it shows the cryptocurrency may be trying to build a base at the intersection of that old resistance band and the rising trendline. If Bitcoin manages to stay above the current zone near $69,000 without falling to the $50,000 region, it would mirror the structure seen at the 2022 bottom. That low formed at a similar confluence where the rising trendline met the previous cycle’s resistance from the 2017 peak. Timeline For A New Bull Run Price levels get all the attention. Time gets almost none, and according to CrypFlow, that is precisely where most people are getting this cycle wrong. The analyst pointed to the Stochastic RSI to track how long this indicator has spent below the zero line during each major bear market cycle, and the historical pattern is striking in its consistency. Related Reading: Analyst Says It’s Time For Bitcoin, But What’s Important About $58,000? In the 2018/2019 cycle, the Stochastic RSI spent approximately 365 days below zero before Bitcoin mounted its real reversal and the next bull market began. The same held true in the 2022/2023 bear market cycle, where Bitcoin spent roughly one full year below zero before the sustained recovery kicked in. This cycle, however, Bitcoin’s Stochastic RSI has only been below zero for around 120 days. Putting it all together, this opens up a scenario where Bitcoin forms a double bottom later this year, likely around October 2026, before the next major bull run begins. This doesn’t necessarily mean Bitcoin is about to crash further. What it does suggest, according to CrypFlow, is that the price action hasn’t completed the slow, grinding work that true cycle bottoms are built on. Featured image from Pngtree, chart from Tradingview.com
BitcoinWorld BlockFills Restructuring Looms as Shocking Lawsuit Alleges Client Fund Misuse Digital asset management firm BlockFills faces imminent restructuring following explosive legal allegations that have sent shockwaves through the cryptocurrency industry. According to a report from Unfolded, the Chicago-based company prepares for significant organizational changes after Dominion Capital filed a lawsuit on February 27, 2025, alleging the firm diverted millions in client funds to cover proprietary trading losses. Consequently, a United States district court has frozen 70 Bitcoin connected to the case, marking a critical development in digital asset regulation enforcement. BlockFills Restructuring Follows Serious Legal Allegations The reported BlockFills restructuring emerges directly from Dominion Capital’s lawsuit, which presents detailed claims about fund management practices. Court documents allege BlockFills utilized client assets to offset substantial losses from its own trading activities. This situation represents a significant breach of fiduciary duty within digital asset management. Furthermore, the timing coincides with increased regulatory scrutiny across cryptocurrency markets globally. Industry analysts note this case could establish important precedents for client protection in decentralized finance environments. The firm’s response strategy will likely influence similar companies facing comparable challenges. Digital asset management requires strict separation between client and proprietary funds. BlockFills, founded in 2018, previously positioned itself as a secure bridge between traditional finance and cryptocurrency markets. The company managed spot and derivatives trading for institutional clients alongside market-making services. However, the current allegations suggest potential systemic issues in operational controls. Regulatory experts emphasize that proper fund segregation remains non-negotiable for licensed financial entities. Meanwhile, the cryptocurrency industry continues evolving its compliance frameworks to match traditional financial standards. Comparative Analysis of Digital Asset Management Standards The table below illustrates key compliance requirements for digital asset managers versus traditional fund managers: Compliance Area Traditional Asset Managers Digital Asset Managers Fund Segregation Strict regulatory requirements Evolving standards Custody Solutions Established custodial banks Mixed custody models Audit Requirements Annual independent audits Varying audit practices Insurance Coverage FDIC/SIPC protections Limited insurance options Legal Proceedings and Frozen Bitcoin Assets The United States court order freezing 70 Bitcoin represents a landmark action in cryptocurrency litigation. Valued at approximately $4.9 million at current prices, these frozen assets directly relate to the alleged fund misuse. Legal experts highlight several important aspects of this development. First, the court’s willingness to freeze digital assets demonstrates growing judicial comfort with cryptocurrency cases. Second, the action shows regulators increasingly treat digital assets like traditional financial instruments. Third, this case may influence how courts handle similar allegations in the future. Dominion Capital’s lawsuit specifically alleges BlockFills transferred client funds to cover losses from unsuccessful trading positions. The complaint details multiple transactions occurring between September 2024 and January 2025. Moreover, the plaintiff claims BlockFills failed to maintain adequate records of these transfers. Consequently, the court granted the asset freeze to prevent further movement of disputed funds. This preventive measure ensures assets remain available for potential restitution if allegations prove true. The legal process will now examine transaction records and fund flow documentation thoroughly. Key elements of the frozen assets situation include: Jurisdictional clarity: The court established authority over cryptocurrency assets Preservation mechanism: Assets moved to court-controlled wallets Valuation methodology: Court accepted current market pricing Precedent value: Establishes framework for future cases Expert Perspectives on Digital Asset Litigation Financial regulation specialists note this case reflects broader industry maturation challenges. According to Dr. Evelyn Reed, Professor of Financial Technology at Stanford University, “The BlockFills situation demonstrates why clear custody rules remain essential for digital assets. While technology advances rapidly, fundamental financial protections cannot lag behind.” Similarly, Michael Torres, former SEC enforcement attorney, observes, “Courts increasingly apply traditional financial regulations to cryptocurrency cases. This trend signals growing institutionalization of digital asset markets.” These expert views underscore the case’s significance beyond immediate parties. Industry Impact and Regulatory Implications The BlockFills restructuring news arrives during heightened regulatory attention on cryptocurrency intermediaries. Multiple agencies currently examine how digital asset managers handle client funds. Specifically, the Securities and Exchange Commission continues expanding its oversight of cryptocurrency investment products. Simultaneously, the Commodity Futures Trading Commission maintains jurisdiction over derivatives trading. This regulatory environment creates complex compliance requirements for firms like BlockFills. Industry participants now watch how this case influences regulatory approaches moving forward. Digital asset management faces unique challenges compared to traditional finance. Blockchain transactions provide transparency but also require specialized security measures. Additionally, the global nature of cryptocurrency markets creates cross-border regulatory complexities. The BlockFills situation highlights why robust internal controls remain critical. Firms must implement strong separation between operational, client, and proprietary funds. Furthermore, regular third-party audits help verify proper fund handling. These practices build trust with institutional clients increasingly entering cryptocurrency markets. Recent regulatory developments affecting digital asset managers include: Enhanced custody requirements from multiple jurisdictions Increased capital reserve mandates for trading firms Stricter reporting obligations for large transactions Broader anti-money laundering enforcement actions Historical Context and Market Evolution The digital asset management industry has evolved significantly since Bitcoin’s creation in 2009. Early cryptocurrency storage involved simple software wallets with minimal security. However, institutional participation necessitated more sophisticated solutions. Consequently, professional custody services emerged around 2017. BlockFills entered this developing market with integrated trading and custody offerings. The company’s current challenges reflect broader industry growing pains. Many digital asset firms initially prioritized technological innovation over compliance infrastructure. Now, regulatory catch-up creates adjustment pressures across the sector. Previous cases involving alleged misuse of client cryptocurrency funds include the 2019 QuadrigaCX collapse and 2020 BitMEX settlements. Each incident prompted regulatory responses and industry practice improvements. The BlockFills situation continues this pattern of market maturation through enforcement actions. Importantly, increased institutional investment brings greater scrutiny to operational practices. Pension funds, endowments, and family offices now allocate to digital assets. These traditional investors demand security standards matching conventional finance. Therefore, the industry’s compliance evolution remains ongoing and essential. Technological Solutions for Fund Protection Advanced technological solutions now help prevent fund misuse in digital asset management. Multi-signature wallets require multiple approvals for transactions. Additionally, real-time auditing tools monitor fund movements continuously. Furthermore, blockchain analytics provide transaction transparency unavailable in traditional finance. These technologies enable better oversight when properly implemented. However, technological solutions alone cannot replace ethical business practices. The BlockFills case demonstrates why both technological and human controls remain necessary. Industry best practices continue evolving as new solutions emerge. Conclusion The reported BlockFills restructuring represents a critical moment for digital asset management standards and regulatory enforcement. As the lawsuit progresses through the legal system, its outcomes will likely influence industry practices significantly. The frozen Bitcoin assets demonstrate courts’ growing capability to handle cryptocurrency cases effectively. Moreover, this situation highlights why robust fund segregation remains fundamental for financial intermediaries. The cryptocurrency industry continues maturing, with cases like BlockFills establishing important precedents. Ultimately, proper client fund protection serves as the foundation for sustainable digital asset market growth. FAQs Q1: What triggered the BlockFills restructuring? The restructuring follows a lawsuit filed by Dominion Capital alleging BlockFills used client funds to cover proprietary trading losses, prompting organizational changes and regulatory scrutiny. Q2: How much Bitcoin did the court freeze in this case? A United States district court ordered 70 Bitcoin frozen, valued at approximately $4.9 million based on current market prices, as part of the legal proceedings. Q3: What are the main allegations against BlockFills? Dominion Capital alleges BlockFills transferred millions in client assets to offset losses from the firm’s own trading activities, potentially violating fiduciary duties. Q4: How does this case affect the broader cryptocurrency industry? This case demonstrates increased regulatory enforcement and establishes precedents for digital asset litigation, potentially leading to stricter compliance requirements across the industry. Q5: What happens next in the legal process? The court will examine evidence, both parties will present arguments, and a determination will be made regarding the allegations, potentially resulting in settlements, judgments, or further restructuring. This post BlockFills Restructuring Looms as Shocking Lawsuit Alleges Client Fund Misuse first appeared on BitcoinWorld .

Bitcoin (BTC) held near $70,000 on March 6 after a geopolitical shock tied to tensions around the Strait of Hormuz pushed energy prices higher and triggered risk-off behavior across global markets. Despite the turbulence, blockchain data shows BTC continuing to leave exchanges, suggesting many holders are not preparing to sell. Energy Shock Rattles Markets Analyst GugaOnChain linked the latest volatility to disruptions around the Strait of Hormuz, a major energy shipping route, which remains effectively closed amid the U.S.-Israeli war on Iran. The market watcher noted that Brent crude traded near $85 and West Texas Intermediate around $81 as the situation pushed up fuel costs, including a $0.27 increase in U.S. gasoline prices during the week. According to the same analysis, the shock drained liquidity across global markets and led to outflows of just under $228 million from Bitcoin exchange-traded funds on March 5. However, exchange flow data showed an unusual divergence. Using a seven-day moving average, Bitcoin’s net exchange flows remained negative, meaning more coins were leaving exchanges than entering them. Daily data showed withdrawals of 500 BTC, while the weekly total reached about 6,500 BTC, leaving trading venues. According to GugaOnChain, such movements often signal that investors are transferring holdings into cold storage, which reduces the supply immediately available for sale. “Given the notable on-chain resilience, the directive is to adopt a tactical defensive stance, maximizing cash now and awaiting confirmation of a reversal in institutional flows before raising exposure again,” the analyst advised. Trading Activity Intensifies on Major Exchanges While coins are leaving exchanges overall, trading activity inside platforms has accelerated. Data shared by Arab Chain on March 6 showed Bitcoin turnover on Binance reaching about 425,000 BTC over the past 30 days, one of the highest readings since December. Binance’s Bitcoin reserves currently stand near 660,000 BTC, and compared with the 30-day turnover figure, the liquidity ratio sits around 0.64, meaning about 64% of those reserves have been traded or transferred during the period. That pattern suggests the same coins are changing hands repeatedly within a short time frame, which reflects increased speculative activity and stronger liquidity circulation within the market. Bitcoin has fallen from a monthly peak attained earlier in the week, with price data from CoinGecko showing the asset trading just under $71,000 at the time of writing, down about 2% in the last 24 hours but still up close to 5% over seven days. At the moment, the flagship cryptocurrency is sitting between renewed institutional demand and global macro pressure. Exchange withdrawals imply that many holders are waiting rather than rushing to exit positions, even as traders remain active inside the market. The post Analysis: Bitcoin Exchange Outflows Signal Holder Conviction Amid Hormuz Crisis appeared first on CryptoPotato .
BitcoinWorld Private Equity Market Cracks Could Devastate Crypto: Analyst Warns of Spillover Risk to Bitcoin Financial markets face mounting pressure as cracks in the private equity sector threaten to spill over into cryptocurrency markets, potentially triggering widespread deleveraging across all asset classes including Bitcoin, according to a prominent analyst warning issued this week. Private Equity Market Cracks Could Spill Over to Crypto BlackRock recently began limiting redemptions for its $26 billion private equity fund. This development follows a significant surge in withdrawal requests from investors. Consequently, market observers now express growing concerns about potential instability spreading from traditional finance to digital assets. Andreja Cobeljic, head of derivatives trading at Swiss-based crypto bank Amina, specifically highlighted these risks during a recent interview with CoinDesk. Private equity funds typically invest in companies not listed on public exchanges. These funds often use substantial leverage to amplify returns. However, redemption pressures can force these funds to liquidate positions quickly. Such forced selling can create cascading effects across financial markets. Furthermore, cryptocurrency markets remain particularly vulnerable to liquidity shocks due to their relative immaturity compared to traditional markets. Understanding the Deleveraging Mechanism Deleveraging occurs when investors reduce their debt levels by selling assets. This process often accelerates during market stress periods. Private credit funds facing redemption pressures must sell holdings to meet withdrawal demands. These sales can depress asset prices across multiple markets simultaneously. Additionally, margin calls can force further selling in leveraged positions. The Ripple Effect Across Asset Classes Cobeljic explained that disorderly liquidations in private markets could trigger secondary shocks. Risk assets like cryptocurrencies might experience amplified volatility during such events. Historical data shows correlation increases between asset classes during market stress. For instance, during the March 2020 liquidity crisis, Bitcoin initially dropped alongside traditional markets before recovering. The table below illustrates key transmission channels between private equity and cryptocurrency markets: Transmission Channel Mechanism Potential Impact on Crypto Liquidity Contagion Forced selling in private markets reduces overall market liquidity Reduced trading volumes and increased volatility in crypto Risk Appetite Shift Investors become risk-averse across all asset classes Capital outflows from speculative assets like cryptocurrencies Margin Call Cascade Leveraged positions face margin calls requiring asset sales Accelerated selling pressure in leveraged crypto positions Institutional Rebalancing Portfolio managers reduce exposure to all risky assets Decreased institutional participation in crypto markets Historical Context and Market Parallels Financial markets experienced similar cross-asset contagion during previous crises. The 2008 financial crisis demonstrated how problems in one sector can spread globally. More recently, the 2022 cryptocurrency market collapse revealed vulnerabilities in leveraged positions. Several crypto lending platforms faced liquidity issues during that period. Traditional finance now shows signs of similar stress patterns. Private equity markets have grown substantially over the past decade. Assets under management in private markets exceeded $10 trillion globally by 2024. This expansion created interconnectedness with public markets. Many institutional investors now hold positions across both traditional and digital assets. Therefore, stress in one area can quickly transmit to others. Expert Analysis on Current Market Conditions Cobeljic emphasized several key points during his analysis. First, redemption pressures on private credit funds have reached concerning levels. Second, forced liquidations could trigger widespread deleveraging across asset classes. Third, cryptocurrencies like Bitcoin could face secondary shocks from disorderly market conditions. Finally, risk management practices must account for these interconnected risks. Other financial experts echo similar concerns about market stability. Regulatory bodies have increased scrutiny on private market liquidity. The Securities and Exchange Commission recently proposed new rules for private fund disclosures. These regulations aim to improve transparency about redemption practices. However, market participants remain cautious about potential systemic risks. Cryptocurrency Market Vulnerabilities Digital asset markets possess unique characteristics that increase vulnerability. Cryptocurrency trading occurs 24/7 across global exchanges. This continuous operation can amplify volatility during traditional market closures. Additionally, cryptocurrency markets have thinner liquidity than major stock exchanges. Large sell orders can therefore create disproportionate price impacts. Several factors contribute to cryptocurrency market sensitivity: High correlation with tech stocks : Bitcoin often moves alongside Nasdaq indices Institutional adoption : Traditional finance firms now participate in crypto markets Leveraged trading : Crypto derivatives markets enable substantial leverage Regulatory uncertainty : Evolving regulations create additional market uncertainty Market data from 2024 shows increasing institutional participation in cryptocurrency markets. Major financial institutions now offer crypto-related products to clients. This integration creates additional transmission channels for financial stress. When traditional markets experience turbulence, cryptocurrency markets often react similarly. Potential Mitigation Strategies Market participants can employ several strategies to manage these risks. Diversification across uncorrelated assets remains fundamental to risk management. Investors should also maintain appropriate liquidity buffers. Stress testing portfolios against various market scenarios provides valuable insights. Furthermore, understanding redemption terms for private fund investments proves essential. Regulatory authorities continue developing frameworks for digital asset markets. The Financial Stability Oversight Council monitors cryptocurrency risks. International organizations like the Financial Stability Board coordinate global approaches. These efforts aim to reduce systemic risks across financial markets. However, market participants must remain vigilant about emerging vulnerabilities. Conclusion Cracks in the private equity market could indeed spill over to crypto, creating significant challenges for digital asset investors. The potential for widespread deleveraging across asset classes represents a genuine concern for market stability. As traditional and digital markets become increasingly interconnected, understanding these transmission mechanisms grows more important. Market participants should monitor redemption pressures in private markets closely. Additionally, maintaining robust risk management practices remains essential for navigating potential volatility. The private equity crypto spillover risk requires careful attention from investors and regulators alike. FAQs Q1: What exactly is happening in the private equity market that concerns crypto analysts? BlackRock has begun limiting redemptions for its $26 billion private equity fund due to a surge in withdrawal requests, creating concerns that forced liquidations could trigger deleveraging that spreads to cryptocurrency markets. Q2: How could problems in private equity affect Bitcoin and other cryptocurrencies? Forced selling in private markets could reduce overall market liquidity and trigger risk aversion, potentially causing capital outflows from speculative assets like cryptocurrencies and increasing volatility across digital asset markets. Q3: What is deleveraging and why does it matter for crypto investors? Deleveraging refers to the process of reducing debt levels by selling assets, which can accelerate during market stress and create cascading selling pressure that affects multiple asset classes simultaneously, including cryptocurrencies. Q4: Are cryptocurrency markets more vulnerable to this type of spillover than traditional markets? Yes, cryptocurrency markets generally have thinner liquidity and higher volatility than major traditional markets, making them more susceptible to disproportionate price impacts from broader financial market stress. Q5: What can investors do to protect their portfolios from this type of cross-market risk? Investors can diversify across uncorrelated assets, maintain appropriate liquidity buffers, stress test portfolios against various market scenarios, and closely monitor redemption pressures in private market investments. This post Private Equity Market Cracks Could Devastate Crypto: Analyst Warns of Spillover Risk to Bitcoin first appeared on BitcoinWorld .

Borrowing against your crypto without selling is a highly useful strategy for accessing liquidity while maintaining market exposure. Crypto loans may serve as a safety net when market conditions demand instant liquidity. With the right platform and structure, you can even minimize borrowing costs and—under certain conditions—effectively borrow at 0% APR. Clapp is one of the most flexible platforms in 2026 for this use case. It allows Bitcoin (BTC) holders to borrow stablecoins or fiat without selling, using a mechanism that significantly reduces idle interest and emphasizes responsible risk management. This article explains how it works, step by step. What Is a Zero-Interest Crypto Loan? In traditional crypto loans, interest begins accruing as soon as your loan is issued — even if you’re not using the funds. That means you can pay interest on capital you never actually needed. With Clapp’s credit-line structure, that changes: You receive an approved credit limit, not a fixed loan. You pay interest only on funds you borrow. The unused portion of your credit line carries 0% APR. Interest applies only when you draw funds. This usage-based interest model means you aren’t charged for liquidity you don’t use — effectively creating 0% interest on unused capital. Why Borrow Against Bitcoin Instead of Selling Selling Bitcoin can crystallize a taxable event and eliminate future upside. Borrowing lets you: Access liquidity without reducing your BTC position Avoid realizing capital gains/losses Maintain exposure to long-term price appreciation Use funds for expenses, trading, hedging, or reinvestment With Clapp, you can borrow stablecoins like USDT or USDC, or even fiat such as EUR, without dipping into your Bitcoin holdings. How Clapp’s Zero-Interest Structure Works Clapp offers flexible crypto credit lines , not fixed loans — and that’s the key to minimizing costs. Here’s how it works: Deposit Bitcoin as collateral— You lock BTC into your Clapp wallet as security. Get a credit limit— Clapp issues a borrowing limit based on the value of your collateral and loan-to-value (LTV) parameters. Borrow only what you need— You can draw any amount up to your limit — but interest applies only to the amount you actually borrow. Unused credit stays interest-free— The portion of your available limit that you haven’t drawn carries 0% APR when LTV is below 20%. Repay at your own pace— Repay partially or in full without fixed schedules or prepayment penalties. As you repay, your available credit line restores automatically. This model gives Clapp a strong advantage over conventional lending products where interest applies immediately on full loan amounts. Example: Using Clapp to Borrow USDT at (Effectively) 0% Interest Using a calculator on Clapp website it is easy to learn what amount you can get. Let’s say: You deposit 1 BTC Clapp assigns a credit limit based on the current exchange rate You borrow the amount of USDT you need (suppose it is $2,000) Example of USDT Loan Calculation from clapp.finance In this example: You pay interest only on the amount you borrowed ($2,000) The remaining sum stays at 0% APR If you don’t use the full credit line, you’re not paying for unused capital This usage-based cost approach is what distinguishes Clapp’s implementation of zero-interest lending from traditional fixed-loan structures. Loan-To-Value (LTV): The Key to Low-Cost Borrowing Loan-to-Value is the critical risk metric in crypto lending which is calculated according to the formula: LTV=Borrowed Amount/Collateral Value Lower LTV means: Lower liquidation risk Lower interest rates on withdrawn funds More stable borrowing terms Clapp encourages conservative utilization. The lower your LTV, the smoother your borrowing experience — especially in volatile markets. LTV determines how cost-effective your borrowing actually is. Lower LTV reduces risk and can reduce APR— as in case with Clapp it is down to 0% when LTV is below 20%. Clapp also provides real-time LTV tracking and margin notifications, so you’re alerted before a position becomes risky — allowing you to add collateral or reduce borrowing proactively. Repayment Flexibility: A Major Advantage Unlike fixed loans with strict repayment schedules, Clapp’s credit line offers: No minimum monthly payment No required repayment schedule No early repayment penalties Immediate credit restoration upon repayment This gives you full control over when and how you repay, which helps you manage LTV and reduce liquidation risk more effectively than fixed-term loans. Multi-Collateral Crypto Loans Clapp offers multi-collateral crypto loans , allowing users to combine over 20 different cryptocurrencies in a single collateral pool. This is beneficial for users with diversified portfolios, as mixing assets—such as BTC, ETH, SOL, and even stablecoins—helps maximize the credit line and spread risk across multiple assets. Relying on a single asset might unlock a lower limit than combining various assets freely. Clapp vs Other Crypto Lending Models Feature Clapp Fixed Loan Platforms Loan Type Credit Line Fixed Term Loan Interest on Unused Funds 0% APR Charged Interest on Borrowed Funds Usage-based Charged on full amount Repayment Terms Flexible Rigid LTV Risk Alerts Yes Varies by platform Best For Cost-efficient liquidity Simple quick loans This comparison highlights why credit-line models like Clapp’s are increasingly preferred for strategic liquidity — especially when preserving positions matters. Who Benefits Most From Clapp’s Zero-Interest Model? Clapp’s structure works well for: Long-term Bitcoin holders who don’t want to sell Traders needing tactical liquidity without dumping assets Investors managing cash flow during market swings Users who prefer usage-based costs over fixed expenses Institutions and high-net-worth holders seeking tailored credit lines The combination of flexible credit, 0% interest on unused funds, and repayment control positions Clapp as one of the most intelligent choices for strategic borrowing in 2026. Bottom Line Zero-interest crypto loans are possible — but only when interest applies to actual borrowing, not unused capital. Clapp’s credit-line model delivers this in a transparent, risk-aware way. By decoupling access to liquidity from interest cost, and by giving borrowers full control over repayment and risk, Clapp enables strategic borrowing without forced selling — one of the defining trends in 2026’s crypto lending landscape.
BitcoinWorld Bitcoin Price Plummets: BTC Falls Below Critical $68,000 Support Level Global cryptocurrency markets witnessed a significant downturn on April 10, 2025, as the Bitcoin price decisively broke below the psychologically important $68,000 threshold. According to real-time data from Binance’s USDT trading pair, BTC was trading at $67,964.06, marking a notable retreat from recent highs. This movement immediately triggered analysis from traders and institutions worldwide, scrutinizing the factors behind the drop. Consequently, market participants are now evaluating key support levels and broader macroeconomic signals. This price action follows a period of consolidation, reminding investors of the asset’s inherent volatility. Bitcoin Price Action and Immediate Market Context The descent below $68,000 represents a key technical development for the leading cryptocurrency. Market monitoring from platforms like Bitcoin World confirmed the breach, which occurred during active Asian and European trading hours. Historically, round-number levels like $70,000 and $68,000 often act as both support and resistance due to concentrated trader interest. Furthermore, the price found initial transaction volume at this new level on the Binance exchange, the world’s largest by volume. This event typically prompts a reassessment of short-term market sentiment. Analysts immediately began comparing this pullback to similar historical corrections. Several concurrent factors likely contributed to the selling pressure. First, recent statements from Federal Reserve officials regarding persistent inflation may have dampened risk appetite. Second, on-chain data often shows profit-taking by long-term holders after sustained rallies. Finally, derivatives market metrics, such as funding rates and open interest, can indicate overheated conditions preceding a correction. The move highlights the interconnected nature of traditional finance and digital asset markets. Therefore, a holistic view is essential for understanding the momentum shift. Analyzing Cryptocurrency Market Volatility Bitcoin’s price volatility remains a defining characteristic, attracting both traders and long-term investors. The drop below $68,000 serves as a recent example of this dynamic. For context, the table below shows key support levels analysts are now watching: Support Level Significance $67,500 Previous weekly low & 20-day moving average zone $65,200 Major swing low from the previous month $62,000 Long-term trend line and institutional buy zone Market structure relies on these technical levels. Additionally, trading volume provides crucial confirmation; a high-volume break is considered more significant than a low-volume drift. Exchange order book data shows substantial bid liquidity clustered around these levels, suggesting areas where buying interest may regroup. Meanwhile, the broader altcoin market often exhibits correlated movements, though with amplified volatility. This environment demands disciplined risk management strategies from all participants. Expert Perspectives on Market Corrections Financial analysts and seasoned crypto traders often frame such pullbacks within a larger cycle context. Historical data reveals that corrections of 10-20% are common within ongoing bull markets. For instance, similar declines occurred in early 2024 and late 2023 before prices resumed their upward trajectory. The current macroeconomic backdrop, including interest rate expectations and dollar strength, plays a critical role in capital flows. Moreover, institutional adoption continues as a structural tailwind, with new ETF products providing regulated exposure. These factors suggest that while short-term volatility is expected, the long-term narrative may remain intact. On-chain analytics firms provide data-driven insights beyond price charts. Metrics such as Net Unrealized Profit/Loss (NUPL) and Spent Output Profit Ratio (SOPR) help gauge overall market profit-taking pressure. Similarly, exchange net flows indicate whether coins are moving to custody (holding) or to exchanges (potential selling). This data collectively builds a picture of investor behavior during downturns. Regulatory developments in major economies also contribute to market sentiment, adding another layer to the analysis. Therefore, a multi-faceted approach is necessary for accurate interpretation. The Impact on Trader Sentiment and Portfolio Strategy The immediate effect of Bitcoin falling below $68,000 is a shift in short-term market sentiment. Fear & Greed Index readings often dip following such moves, reflecting increased caution. For active traders, this volatility creates opportunities but also elevates risk. Key strategies employed during such phases include: Dollar-Cost Averaging (DCA): Systematic buying at predetermined intervals to average entry prices. Rebalancing: Adjusting portfolio allocations back to target weights between Bitcoin and other assets. Hedging: Using options or futures contracts to protect against further downside. Long-term investors, often referred to as ‘HODLers,’ typically view these dips as potential accumulation zones, provided their fundamental thesis remains unchanged. The psychological aspect of watching portfolio values decrease tests investor conviction. However, historical patterns show that disciplined strategies have generally outperformed reactive trading over multi-year horizons. Market structure evolves with each cycle, integrating more sophisticated products and participants. Conclusion The Bitcoin price movement below $68,000 underscores the volatile and dynamic nature of the cryptocurrency market. This event triggers essential analysis of technical support levels, macroeconomic influences, and on-chain data. While short-term sentiment may waver, the broader adoption trajectory and technological fundamentals continue to develop. Market participants must prioritize risk management and informed decision-making over emotional reactions. Ultimately, price discovery in this emerging asset class remains a complex process, reflecting a blend of speculation, utility, and macroeconomic forces. FAQs Q1: Why did Bitcoin fall below $68,000? Multiple factors likely contributed, including macroeconomic concerns (like Federal Reserve policy), profit-taking by investors after a rally, and technical selling upon breaking key support levels. Market movements are rarely due to a single cause. Q2: Is this a normal correction for Bitcoin? Yes, historically. Bull markets in Bitcoin frequently experience pullbacks of 10-30%. These corrections are considered healthy by many analysts as they shake out excess leverage and allow the market to consolidate before potential further advances. Q3: What is the next major support level for BTC? Analysts are watching the $67,500 area (a recent low and moving average zone), followed by $65,200 (a previous monthly swing low). A break below these could see the price test the $62,000 region, a key long-term trend level. Q4: How does this affect other cryptocurrencies (altcoins)? Altcoin markets are generally highly correlated with Bitcoin’s price action. A significant drop in BTC often leads to larger percentage declines in altcoins. However, the correlation can vary based on individual project developments and market cycles. Q5: Should investors buy the dip? Investment decisions depend on individual risk tolerance, time horizon, and financial strategy. Some long-term investors use dollar-cost averaging to buy during dips, while others wait for clearer technical or fundamental signals. Consulting a qualified financial advisor is recommended. This post Bitcoin Price Plummets: BTC Falls Below Critical $68,000 Support Level first appeared on BitcoinWorld .

Instant crypto loans have become one of the most widely used financial tools in 2026, allowing users to unlock liquidity without selling their Bitcoin, Ethereum, or other long-term holdings. Whether used for trading, personal expenses, or managing cash flow, these loan structures offer speed — but differ significantly in flexibility, interest costs, and risk controls. Clapp, Nexo, and YouHodler are three well-known platforms offering near-instant borrowing. Yet the way each platform structures its loans—and the total borrowing experience—varies dramatically. This review examines how they compare so users can choose the most suitable option. 1. Clapp — Instant Credit Line With 0% APR on Unused Funds Clapp approaches instant borrowing differently from traditional crypto lenders. Instead of issuing a fixed loan, Clapp gives users a revolving crypto credit line. The credit limit is available immediately after collateral is deposited, and borrowers can draw funds (USDT, USDC, or EUR) instantly. Key Advantages of Clapp Credit Line • 0% APR on unused creditOnly borrowed amounts incur interest, making Clapp one of the most cost-efficient solutions for users who want access to liquidity without always using it. • Instant withdrawalsOnce the credit line is active, users can withdraw funds 24/7 with no approval delays. • Flexible repaymentNo fixed schedule, no monthly minimums, and no penalties for early repayment. Borrowers repay on their own terms. • Real-time LTV monitoring + margin alertsUsers receive notifications when their loan-to-value ratio approaches risk levels, helping avoid liquidation during volatility. • Multi-asset collateralCollateral can include BTC, ETH, SOL, stablecoins, and other digital assets—over 19 in a single pool. • Corporate credit lines from 1% APRDesigned for corporate and high-net-worth borrowers with negotiable LTV terms. Best For Borrowers who want instant access, low cost, and maximum control over interest and risk. 2. Nexo — Instant Loans With Loyalty-Based Pricing Nexo remains a familiar name in crypto lending, offering instant credit lines backed by major assets like BTC, ETH, and SOL. Borrowers can access stablecoins or fiat immediately after approval. Key Features Instant liquidity for most major assets Borrowing rates tied to Nexo’s loyalty program Flexible credit line structure with interest on borrowed amounts Fiat payout options in supported regions Limitations Best rates require holding or staking NEXO tokens No 0% APR component LTV tiers vary by loyalty status and collateral type Best For Users already participating in the Nexo ecosystem and comfortable with loyalty-tier pricing models. 3. YouHodler — Instant Access With High LTV Options YouHodler is known for aggressive loan terms and fast issuance. Borrowers can access USDT or other stablecoins backed by BTC, ETH, LTC, or a range of altcoins. Key Features High LTV options (often up to 90%) Very fast approval and funding Wide collateral support including smaller-cap assets Limitations Higher interest rates due to aggressive LTV Increased liquidation risk during volatile markets Less transparency in long-term risk management Fixed-term repayment conditions Best For Borrowers seeking maximum leverage and short-term liquidity — not long-term flexibility or low risk. Instant Crypto Loans in 2026 Feature Clapp Nexo YouHodler Borrowing Structure Revolving credit line Credit line Fixed-term loan Speed of Funding Instant Instant Instant Interest on Unused Funds 0% APR No No Collateral Assets BTC, ETH, SOL + 16 others Wide range Wide range LTV Range 20–90% (flexible) 20–60% Up to ~90% Repayment Terms Fully flexible Flexible Fixed Risk Controls Real-time LTV + alerts Varies by tier High liquidation sensitivity Best For Low-cost, controlled borrowing Loyalty program users High-risk, high-LTV borrowers What Borrowers Should Consider in 2026 1. Flexibility Over Maximum LTV High LTV ratios increase liquidation risk dramatically. Platforms like Clapp and Nexo encourage more conservative borrowing, which aligns better with 2026’s risk-aware user base. 2. Interest Structure Matters Clapp’s usage-based interest model (0% APR on unused credit) provides superior cost control compared to fixed-term lenders. 3. Instant Liquidity Does Not Mean Instant Safety High-speed borrowing is valuable, but real-time tools like LTV monitoring, margin alerts, and flexible repayment are the features that protect users during market volatility. 4. Borrow Only What You Need Credit-line platforms prevent borrowers from paying interest on unnecessary funds, while fixed loans lock users into full interest obligations immediately. Final Thoughts Instant crypto loans are now a standard financial tool for investors looking to preserve their core holdings while accessing liquidity. But not all instant loans are designed equally. Clapp stands out for combining speed, flexible credit-line mechanics, 0% APR on unused funds, and transparent LTV risk management — making it the most borrower-friendly option for 2026. Nexo offers strong credit-line features but relies on loyalty tiers for competitive rates, while YouHodler provides rapid funding at the cost of higher leverage and higher risk. For borrowers who want stable, predictable, and efficient access to liquidity without forced selling, Clapp represents the most balanced solution. Disclaimer: This article is provided for informational purposes only. It is not offered or intended to be used as legal, tax, investment, financial, or other advice.

Short sellers have capitalized on Bitcoin’s recent decline as bulls struggle for momentum. Analysts warn of deeper corrections, drawing parallels to previous crypto downturns. Continue Reading: Short Sellers Drive Bitcoin’s Latest Drop as Bulls Await a Turnaround The post Short Sellers Drive Bitcoin’s Latest Drop as Bulls Await a Turnaround appeared first on COINTURK NEWS .

Summary I found BitFuFu deeply undervalued a few months ago relative to its peers based on a market cap/hashrate comparison. Despite being attractively valued, FUFU stock has performed poorly since then amid the lackluster performance of the broad crypto market. After studying historical BTC prices, I have uncovered an interesting relationship between BTC prices and the global money supply. If history repeats, we are looking at a potential BTC reversal. Bitcoin prices also seem poised to finally benefit from the previous halving event that occurred almost 2 years ago. There are a few reasons to consider BitFuFu as an investment vehicle to gain exposure to a potential breakthrough in Bitcoin prices. Being a crypto investor has not been easy in the past year or so. After seeing Bitcoin hit an all-time high north of $120,000, investors have had to stomach a staggering decline in BTC prices. At one point earlier last month, the drawdown from all-time highs eclipsed 50%. What is even more concerning is that this halving of BTC prices occurred within just four months. Although I do not have direct exposure to BTC, as I explained in a recent analysis on Coinbase Global, Inc. ( COIN ), the crypto winter has affected my portfolio indirectly because of my exposure to a few crypto stocks. This brings me to BitFuFu, Inc. ( FUFU ). Although I do not own BitFuFu stock, I have covered FUFU a few times over the past 12 months, as I found the company deeply undervalued relative to its peers based on a market cap/hashrate comparison. Today, amid interesting macro developments, I believe FUFU offers a unique value proposition to long-term investors wanting to gain exposure to BTC. Global Money Supply Growth Trends Paint A Promising Picture For Bitcoin Bitcoin has made a strong comeback since last Saturday. As of this writing, BTC is up 12% since the start of Middle East tensions and is trading just below $71,500. This trend reversal comes on the back of investors fleeing risk assets to seek the safety of assets with perceived hedging benefits, such as gold and Bitcoin. Given the macro risks we are facing today involve security risks, Bitcoin is actually in a unique position to emerge as the hedging instrument of choice among both retail and institutional investors, as it hedges against adverse geopolitical developments as well as sovereign risk. This is because BTC is decentralized, unlike any fiat currency. On the other hand, if inflation spikes as a result of persistently high oil prices, the Fed is likely to delay its rate cuts. This could be bad news for cryptos, including Bitcoin. Empirical evidence suggests cryptos perform well when the global money supply increases. The below chart illustrates this correlation between global money supply (M2) and BTC prices. Exhibit 1: Global M2 supply and BTC prices Bitcoin CounterFlow This is where things get interesting. Despite the Fed maintaining its cautious stance and wanting to closely evaluate macro indicators before turning more dovish, the global money supply has grown in the past few months, aided by favorable policy decisions by other central banks. Many central banks have cut rates in recent months. This list includes almost all GCC nations, Turkey, Russia, India, Mexico, Thailand, Switzerland, Australia, and even Poland. As the above chart illustrates, these expansionary policy decisions have led to a surge in M2 supply to almost $119 trillion as of mid-February. This represents YoY growth of 10.84%. This is a very interesting data point. Historically, the most aggressive BTC bull runs have coincided with strong spikes in M2 supply. More often than not, double-digit YoY growth in M2 supply has triggered Bitcoin bull runs. Today, given geopolitical tensions, we have every reason to believe that many countries will be forced to print money to fund their military budgets. If America’s active involvement in Middle East tensions lasts more than a few days, as initially expected, chances are that the U.S. will have to boost its money supply. This is consistent with historical evidence. For example, during World War II, the debt-to-GDP ratio rose to over 100% as the U.S. government was forced to print money to support its military spending. Exhibit 2: U.S. debt-to-GDP ratio Voronoi Given the positive correlation between global M2 supply and BTC prices, I believe we are nearing an inflection point for Bitcoin. Institutional Flows Remain Strong Relying on a single macro indicator is not a foolproof strategy to predict a reversal of BTC prices. Over the past 12 months, institutional investors have taken a real interest in Bitcoin and other cryptocurrencies. Monitoring institutional fund flows, therefore, can be an effective tool to identify trend reversals. Amid the crypto winter, Bitcoin ETFs have seen strong selling pressure since last October. According to Bloomberg data, between October 2025 and late February, Bitcoin ETFs recorded $9 billion in outflows. However, things have turned around since February 24. Since then, Bitcoin ETFs have recorded net inflows of $1.7 billion. This is a major turn of fund flows. I believe these inflows are driven by institutional investors wanting to gain exposure to Bitcoin as a hedging instrument amid global uncertainties. Bitcoin Halving Impact May Finally Be Felt In Coming Months The most recent Bitcoin halving occurred in April 2024, when the daily reward dropped from 900 to 450 BTC. Under normal circumstances, this should result in a lower supply of BTC. However, empirical evidence suggests that the opposite happens in the initial stages following a halving event. This is because thinly profitable miners resort to aggressive BTC divestitures to cover the cost of their mining operations. This creates selling pressure in the market. Now that we are closing in on the second anniversary of the latest halving event, I believe this treasury exhaustion among marginally profitable miners is coming to an end. This should pave the way for a supply deficit in BTC moving forward. There is a very real possibility of this expected supply deficit meeting a strong uptick in demand amid geopolitical tensions. This could set up a perfect platform for BTC prices to break through to the upside. Why BitFuFu Is A Great Pick To Gain Exposure To A Potential Bitcoin Comeback In addition to investing directly in BTC, investors can invest in crypto stocks to gain exposure to a potential reversal in Bitcoin prices. As I revealed in a separate analysis a few weeks ago, I doubled down on my Coinbase long position, as I believe Coinbase will benefit no matter which cryptocurrency dominates the world in the long run. My bet on Coinbase is a bet on the success of the blockchain technology. When it comes to Bitcoin, FUFU offers a unique value proposition to long-term investors because of a few reasons. BitFuFu is exposed to BTC prices directly through its self-mining business but also provides a shield against fully relying on price movements with its diversification into the cloud mining business. For those who are not familiar with BitFuFu, the company’s cloud mining business, which is nestled under the mining services segment, serves 648,000 registered users who pay fees to access its services. Exhibit 3: BitFuFu’s business model Investor Presentation If you take a look at some of the biggest public crypto miners, a big challenge faced by them is their reliance on block rewards. While BitFuFu also earns a chunk of its revenue from block rewards, the cloud mining business helps the company earn fee-based revenue by selling mining contracts. This makes BitFuFu one of the most diversified public crypto miners. In the third quarter of 2025, this segment accounted for ~68% of total revenue ($122.9 million). Exhibit 4: BitFuFu’s segment revenue in Q3 2025 10-Q Despite operating in two main business segments, BitFuFu has the flexibility to allocate resources to the most rewarding business at a given point in time. This is achieved with the use of its Aladdin system, which routes hashrate to maximize yield. This flexibility makes BitFuFu even more attractive, as it enables the company to prioritize profitable growth rather than diversifying for the sake of it. When crypto markets turn a corner, the company can effectively prioritize the self-mining business, which exposes investors to asymmetric upside. When the opposite is true, BitFuFu can focus on its cloud mining business to generate sufficient cash to function without having to deplete its crypto treasury. This balanced business model is one of the main reasons why I fell in love with the company a few months ago. Energy Investments Boost BitFuFu’s Appeal I have discussed BitFuFu’s energy investments in detail in previous analyses. I thought of touching on them yet again today given the uncertain geopolitical environment we have found ourselves in. Energy prices have already spiked due to Middle East tensions, and this is not good news for Bitcoin miners, as energy is one of the biggest operating costs for every miner. Before this escalation in tensions, I always looked at BitFuFu’s energy investments as a cost-saving measure. But today, I consider these investments to provide the company with a competitive edge amid global uncertainties. The company’s energy independence strategy is centered on expanding into regions, sometimes even remote, with cheap access to renewable energy. The Ethiopian Hydro Shield is a classic example of this. BitFuFu now operates an 80 MW data center in Ethiopia. Since this facility is powered by hydroelectricity, it makes the company less immune to oil price shocks as well. Exhibit 5: Data center expansion Investor Presentation In addition to helping BitFuFu secure energy independence, these investments will also be accretive to margins, given that the company is exposed to energy prices well below the world average in most of these regions. The Healthy Balance Sheet Adds Another Layer Of Safety Given the many uncertainties facing the crypto industry, it is almost impossible to talk about a miner’s prospects without commenting on its balance sheet health. BitFuFu, thankfully, has a very strong liquidity position today. This makes the company immune to geopolitical shocks in the foreseeable future. The company ended Q3 2025 with ~$255 million in cash and equivalents (this includes digital assets as well). BitFuFu, in fact, ended Q3 with a negative net debt position. Against total long-term debt of $141.3 million (including payables), the company had total liquidity of $254.8 million. This translates to a net cash position of almost $114 million. Based on BitFuFu’s January performance update , the company held 1,796 BTC on its balance sheet, up from 1,780 the month before. This MoM growth is a sign that BitFuFu is continuing to hoard BTC rather than being forced to liquidate its reserves. This is a good sign at a time when many less-profitable miners are liquidating their BTC reserves to cover operating costs. In addition to this already strong liquidity position, BitFuFu has an option to tap into capital markets easily as well. The $150 million ATM equity offering that was approved last June still has $144 million in remaining capacity. Risks BitFuFu, similar to its crypto mining peers, relies heavily on favorable crypto market conditions. Despite its diversified business model, the company’s fortunes remain closely tied to BTC prices. A crypto winter that lasts years, not months, will prove to be a massive drag on its financial performance. Investors should also keep an eye on changing energy regulations in global regions where BitFuFu has expanded into. This risk became evident when the company revealed that a new tariff structure was announced in Ethiopia late last year. While the new prices are still very economical compared to many other global regions, this highlights the need to keep a close eye on the regulatory environment for BitFuFu’s data centers. Takeaway Bitcoin has made a strong comeback since the U.S. and Israel attacked Iran last Saturday. This is consistent with the hedging benefits associated with BTC. Looking at the long term, I believe Bitcoin prices are likely to be driven by global money supply movements rather than a risk-off trade. Based on recent M2 supply trends, BTC seems to be entering an inflection point that could help prices break through to the upside. Amid these interesting developments, I view BitFuFu as offering investors a unique value proposition with its balanced business strategy and energy independence.

Utexo raised $7.5 million to develop direct USDT transfers on the Bitcoin network. The platform simplifies technical barriers and boosts privacy for high-volume stablecoin payments. Continue Reading: Utexo Secures $7.5 Million to Power Direct USDT Transfers on Bitcoin Network The post Utexo Secures $7.5 Million to Power Direct USDT Transfers on Bitcoin Network appeared first on COINTURK NEWS .
After a period of extended downside pressure, market participants are identifying a “bottoming out” process

More on Bitcoin USD Whale's Insight: From Conflict Shock To Liquidity Return - Is Crypto Forming A Base? Every Metric Screams Buy - So Why Is Bitcoin Still Falling? I Was Wrong: Bitcoin Didn't Become A Currency Of Exchange Bitcoin slips below key level as investors brace for U.S. jobs data, Middle East tensions rise Crypto bill hits new impasse, as banks reject White House compromise - report
• Sentiment Score: AI-powered analysis scoring articles from -100 (very bearish) to +100 (very bullish)
• Impact Level: Estimated market impact based on content and regulatory keywords (High/Medium/Low)
• Jurisdiction: Geographic focus of the news (US, EU, Asia, Global, or Other)
• Regulatory Flag: Indicates articles focused on regulations, enforcement, or legal developments
• Keywords: Key sentiment-driving terms extracted from the article
• News articles are aggregated from trusted cryptocurrency sources via CryptoCompare API
• Updates automatically every 5 minutes to ensure you have the latest information